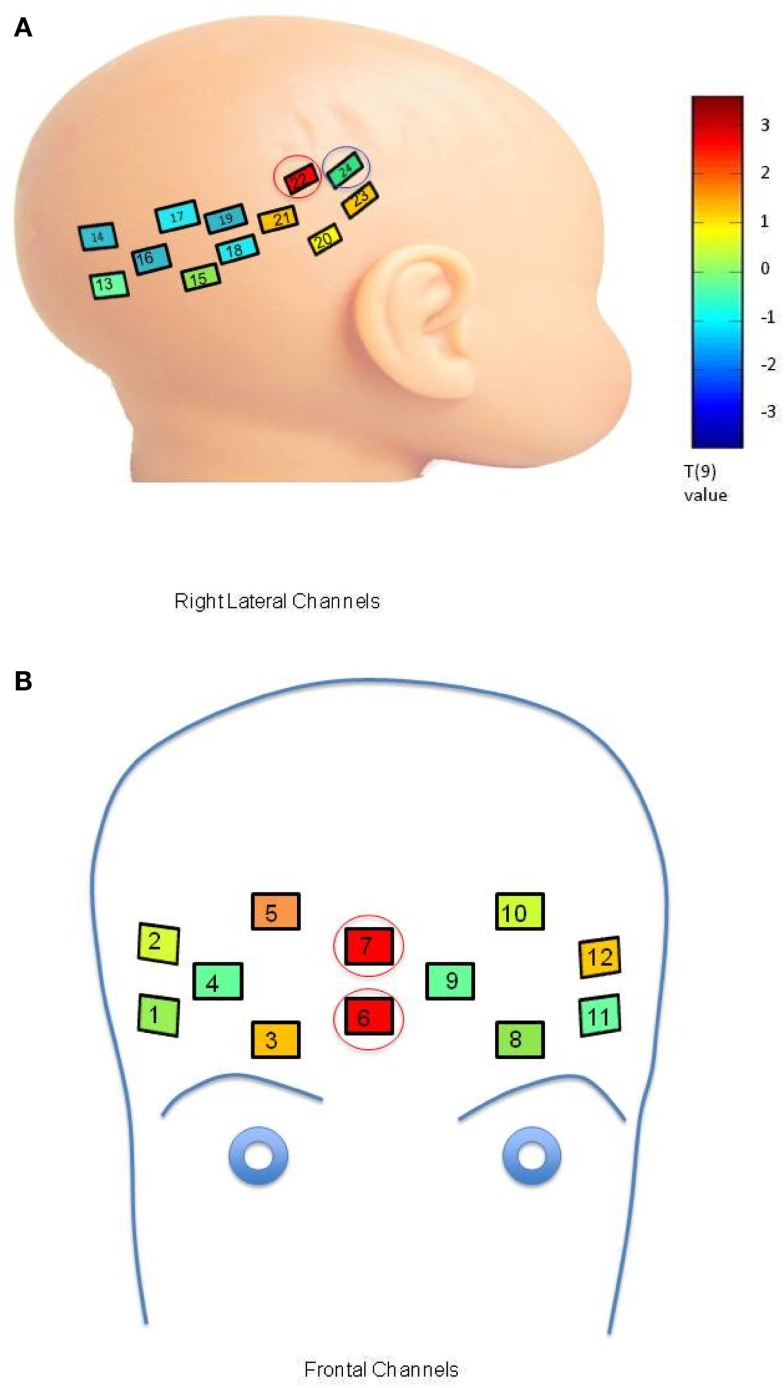
Figure A1.
(A) Comparison of response to neutral mother and neutral stranger faces within the LRC group. Channel placement and numbers are shown on the right lateral portions of the infant head. Colors within the channels indicate a T-value map across 10 LRC subjects comparing oxy-hemoglobin response to the neutral mother’s face as compared to the neutral stranger’s face at each channel location (color bar, p = 0.05, Bonferroni corrected). The channel circled in red indicates significant differences in oxy-hemoglobin response, and the channel circled in blue indicates significant differences in deoxy-hemoglobin response. (B) Comparison of Oxy-hemoglobin Response to Smiling Mother and Smiling Stranger Faces within the LRC group. Significant activation occurred in channels placed on the front of the head (numbered as shown). Colors within the channels indicate a T-value map across 10 LRC subjects comparing oxy-hemoglobin response to the smiling mother’s face as compared to the smiling stranger’s face. Channels circled in red indicate significant differences in oxy-hemoglobin response.

