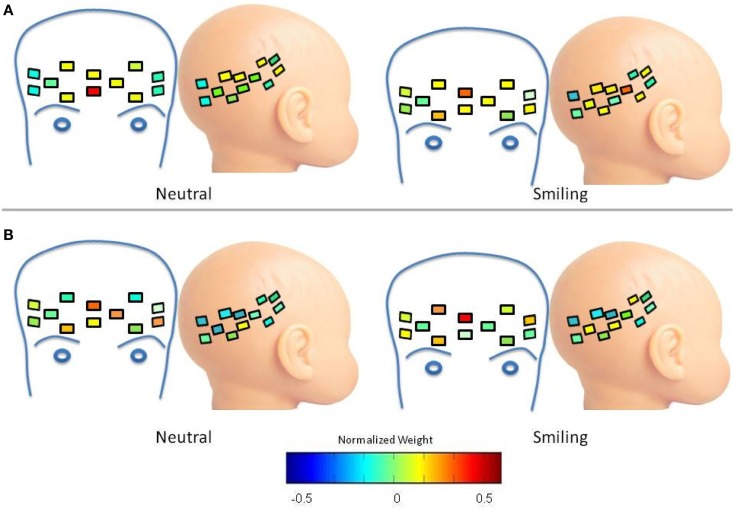
Figure A3.
Spatial distribution of deoxy-hemoglobin waveform 1. Colors within channels indicate normalized weights for this waveform according to the color bar. (A) LRC Group. The waveform has greater frontal weight in the neutral condition, and is distributed between focal frontal and right lateral regions in the smiling condition (B) HRA Group. Frontal weight increases during the smiling condition, resulting in a greater mean weight across frontal channels for the smiling as compared to neutral conditions (p = 0.0002).

