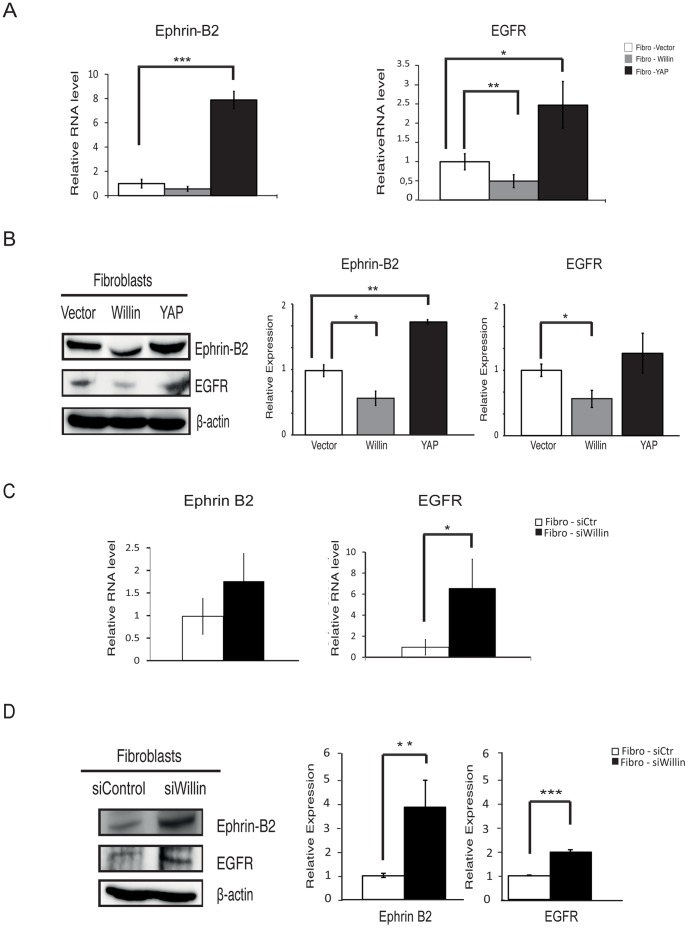
Figure 5. Willin is an upstream regulator of EphrinB2 and EGFR.
(A) Willin expression is antagonistic to YAP EphrinB2 and EGFR transcriptional regulation. mRNA levels of Ephrin B2 and EGFR were probed by quantitative real-time PCR. mRNA levels were compared with the empty vector control fibroblast cells (set to 1). At the transcriptional level, Willin overexpression decreases EGFR and to a less extend EphrinB2 whereas YAP results in an increase in both EphrinB2 and EGFR mRNA levels. Means were calculated from Ct values in six independent experiments. β-actin was used to normalize for variances in input cDNA. Error bars represent ±s.e. (n = 6). Fibro-vector vs fibro-Willin or fibro-YAP for the analysed genes: *p<0.05; **p<0.01; ***p<0.001; Student’s t-test. Fibroblasts-vector vs fibroblasts-Willin: EphrinB2 (p = 0.055); Student’s t-test. (B) Immunoblots analysis of EphrinB2 and EGFR show loss of expression upon ectopic Willin expression and gain of EphrinB2 expression upon YAP overexpression when compared to empty vector control (set to 1). β-actin was used as a loading control. Means were calculated from six independent experiments. Error bars represent ±s.e. (n = 6). Fibro-vector vs fibro-Willin or fibro-YAP: *p<0.05; **p<0.01; Student’s t-test. Fibroblasts-vector vs fibroblasts-YAP: EGFR (p = 0.40); Student’s t-test. (C) EGFR mRNA levels are upregulated upon Willin knockdown but EphrinB2 does not show statistical significant change at the transcriptional level. mRNA levels of Ephrin B2 and EGFR were probed by quantitative real-time PCR and mRNA levels compared with the fibro-siCtr cells (set to 1). Means were calculated from Ct values in six independent experiments. β-actin was used to normalize for variances in input cDNA. Error bars represent ±s.e. (n = 6). Fibro-siCtr vs fibro-siWillin cells: *p<0.05; Student’s t-test. Fibro-siCtr vs Fibro-siWillin cells: EphrinB2 (p = 0.555); Student’s t-test. (D) Immunoblots analysis of EphrinB2 and EGFR show upregulated expression when Willin is knockdown. Relative expression was determined compared to background expression (Fibro-siCtr cells set to 1). β-actin was used as a loading control. Means were calculated from three independent experiments. Error bars represent ±s.e. (n = 3). Fibro-siCtr vs Fibro-siWillin cells: **p<0.01; ***p<0.001; Student’s t-test.

