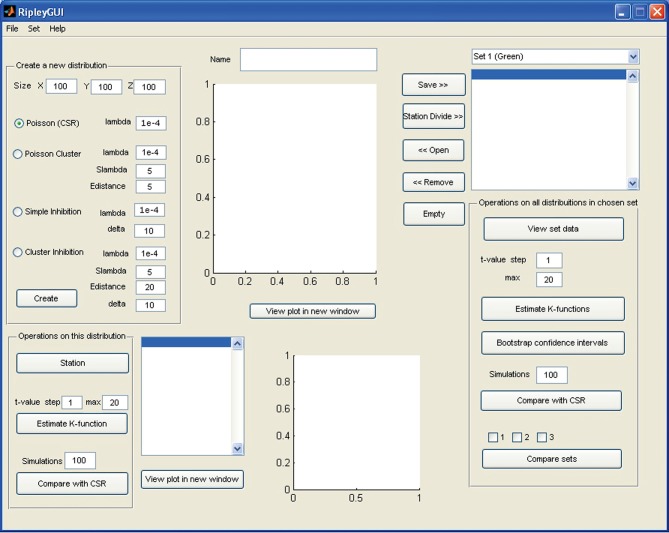
Figure 1.
Screenshot of the opening screen of RipleyGUI. The upper left panel (Create a new distribution) is allocated for distribution simulations. Each of the four reference distributions (see section Reference distributions) can be tuned with intensity and other parameters. The simulated distributions are displayed in the upper center panel (Name). The lower left panel (Operations on this distribution) is designed for analysis of the distribution on display in the upper central panel (Name). The right panel (Operations on all distributions in a chosen set) is designed for saving, managing, and analyzing single or multiple data sets. The results of all the analysis can be viewed inside or outside of RipleyGUI depending on the user's preference. All analysis-related parameters are tunable in their corresponding panels.

