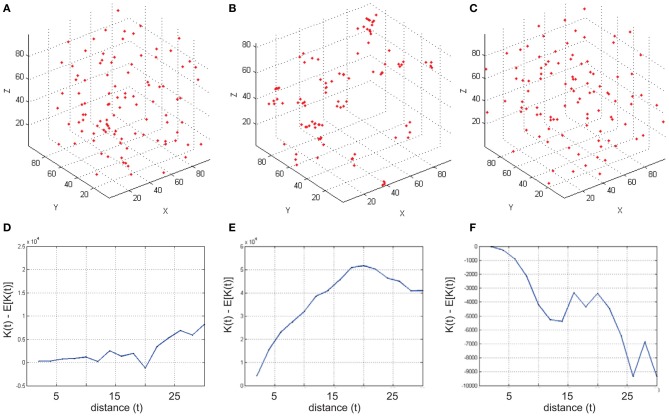
Figure 2.
Examples of simulated reference cell distributions. (A,D) The Homogenous Poisson Process [Complete spatial randomness (CSR)]. The difference (t) – E[(t)] is close to 0 and we cannot discard that the sample distribution is following CSR. (B,E) (t) – E[(t)] is positive indicating aggregation. (C,F) (t) – E[(t)] is negative indicating inhibition (dispersion). Data was generated using a t-value step 2, and max 30.

