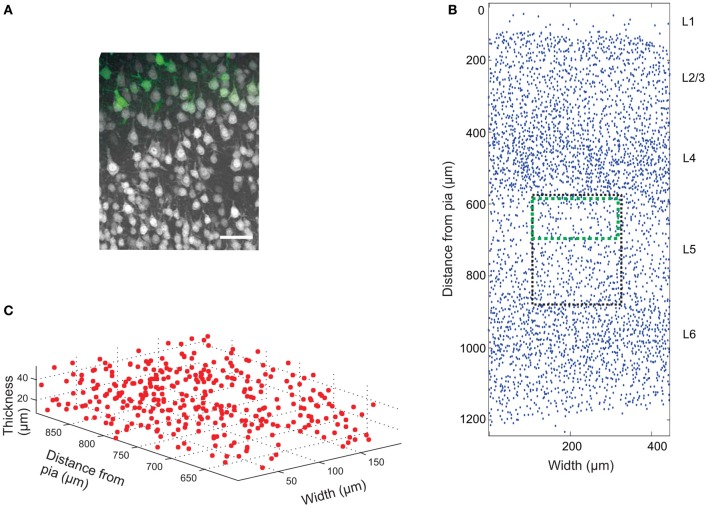
Figure 3.
Cell count data. (A) Confocal image (z-projection) of a brain slice showing neurons (gray) labeled with Neuronal Nuclei (NeuN) antibodies, and genetically EGFP-labeled layer 5a corticostriatal pyramidal cells (green). Scale bar 50 μm. (B) 2D projection of manually placed markers indicating the position of NeuN-labeled cell bodies in a brain slice of the somatosensory mouse cortex cut in the coronal plane. Pia matter is at y = 0, and the y-axis is distance from pia matter; x-axis is the width of the tissue slice. The six cortical layers are labeled L1 (Layer 1), etc. The black box shows the approximate position of the image in (A) and the green box the approximate position of the EGFP-labeled cells. A sub-section of the image is plotted in 3D in (C).

