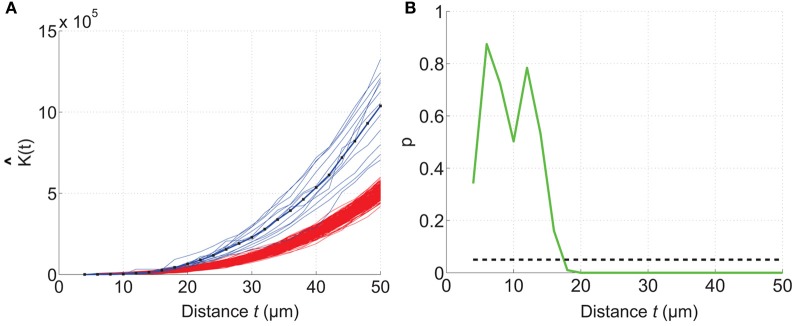
Figure 4.

Comparing a test distribution with a CSR distribution. Etv-pyramid distributions in visual cortex (vc) are not randomly distributed. The samples (n = 6) have been divided and rotated (using Divide and Station) to obtain stationarity. 200 CSR distributions were generated, and used to create a confidence interval for the CSR hypothesis. (A) The estimated K-function for etv-pyramids (blue lines) compared to simulated CSR distributions (red lines). The K-function is estimated for t-values between 4 and 50 μm with a 2 μm step size. (B) P-values from the hypothesis test of CSR. For t = 18 μm the etv-pyramid distributions differs from CSR with 95% significance. These types of graphs can be generated with the RipleyGUI.
