
Figure 3.
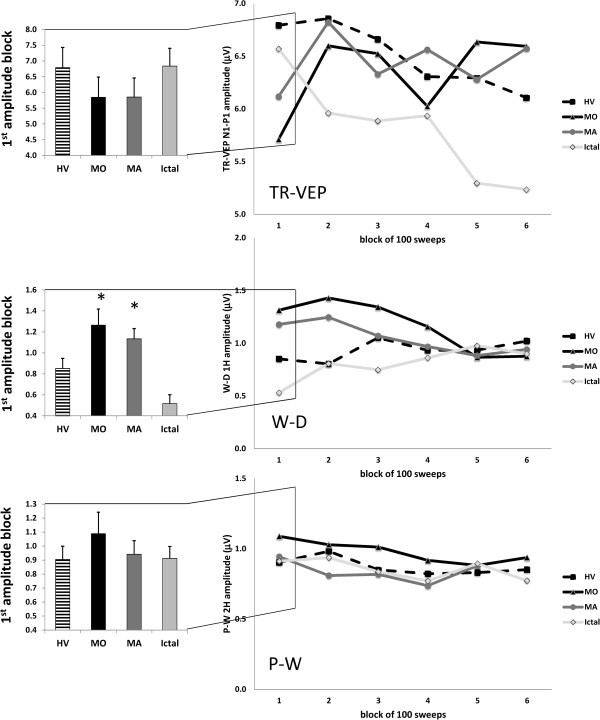
Left panel: transient N1-P1 [upper], steady-state windmill-dartboard 1H [middle] and partial-windmill 2H [lower] mean amplitudes in the first block of 100 averaged responses; Right panel: Visual evoked potential (VEP) amplitude block averages in each study group and for the three types of visual stimuli: transient (TR-)VEP [upper], steady state windmill-dartboard (W-D) [middle] and partial-windmill (P-R) [lower] VEPs (HV, healthy volunteers; MO, migraine without aura interictally; MA, migraine with aura interictally; Ictal, migraine without aura ictally); data expressed as mean ± SD).