
Figure 3.
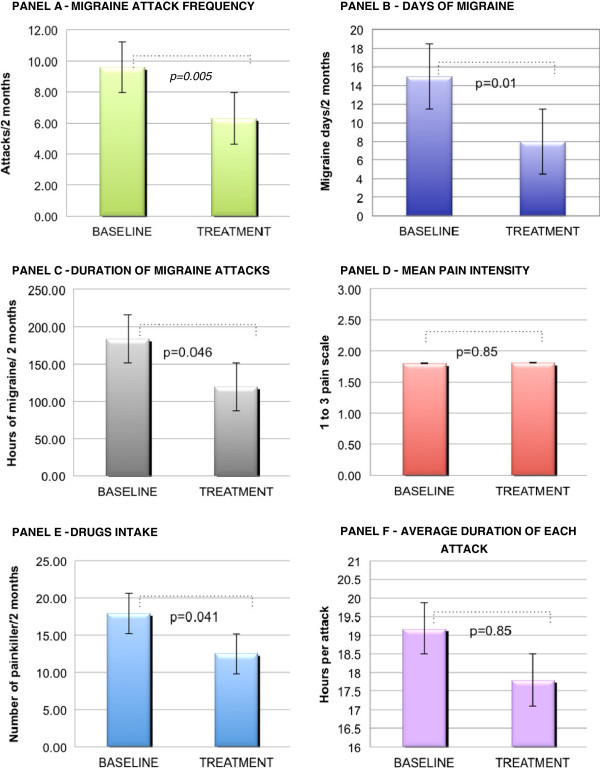
This figure shows the outcome of the therapeutic pilot trial. The averages and standard deviations (black lines) of the following clinical parameters are displayed at baseline and for the whole period of tDCS treatment: migraine frequency (Panel A), days with migraine (Panel B), cumulated duration of all headache attacks (Panel C), pain intensity per attack (Panel D), acute drug intake (Panel E) and duration of each single attack (Panel F).