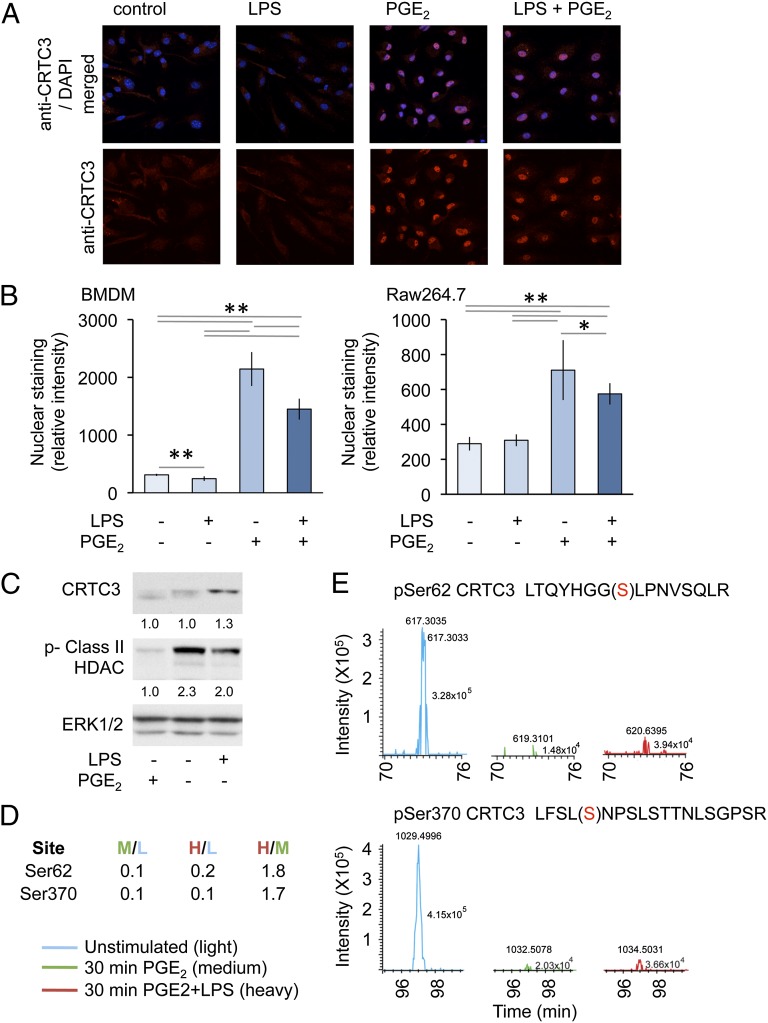
FIGURE 6.
PGE2 regulates CRCT3 localization and phosphorylation. (A and B) BMDMs isolated from wild-type mice or RAW264.7 cells were plated onto coverslips. Cells were stimulated for 1 h with 100 ng/ml LPS or 10 μM PGE2 as indicated. Cells were then fixed and stained with an anti-CRTC3 Ab (red) and DAPI (blue). Images were obtained by confocal microscopy. Original magnification ×100; the view shown is 127.9 μ wide. Representative images from BMDMs are shown (A). Nuclear staining was quantified as described in the methods. Error bars represent SD from 10 independent images; *p < 0.05, **p < 0.01 (Student t test) (B). (C) RAW264.7 cells were stimulated with either LPS or PGE2 for 30 min, and the levels of CRTC3, ERK1/2, and phosphorylated class II HDACs were determined by immunoblotting. Levels of CRTC3 and phosphorylated HDAC protein were quantified relative to total ERK1/2 protein and represented as a ratio of the unstimulated control. (D and E) RAW264.7 cells were labeled with SILAC medium as described in Materials and Methods. Cells grown in light media were left untreated, whereas cells grown in medium media were treated with 10 μM PGE2, and cells grown in heavy media were stimulated with a combination of 10 μM PGE2 and 100 ng/ml LPS. After 30 min, cells were lysed and subjected to a phosphoproteomic screen as described in Materials and Methods. Mass spectroscopy spectra for peptides corresponding to CRTC3 phosphorylated on Ser62 and Ser370 are shown (E) and the ratios of these peptides in the different conditions are given in (D).

