FIGURE 8.
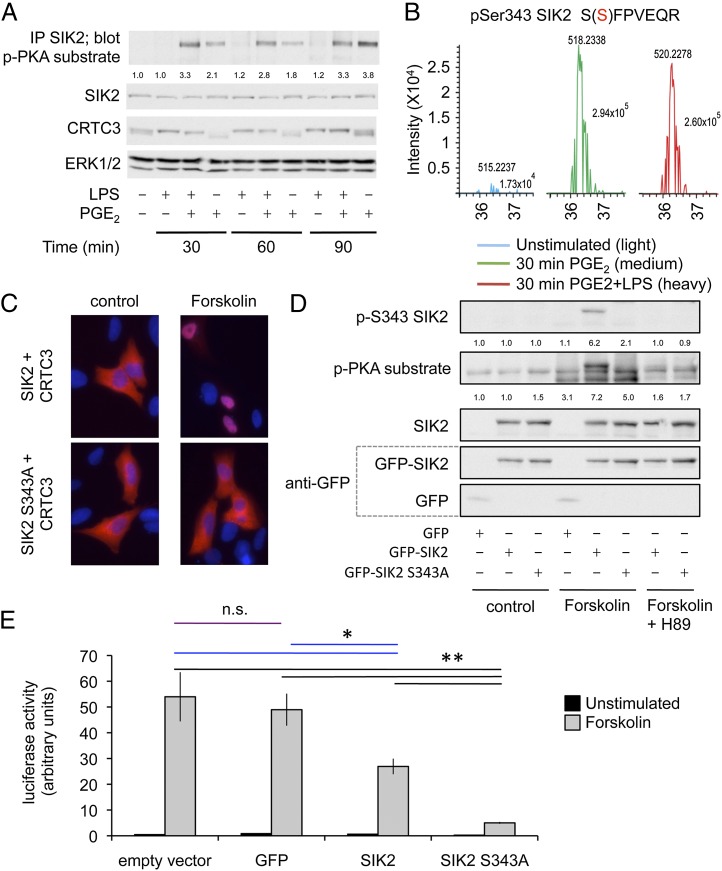
PGE2 regulates the ability of SIK to inhibit CRTC activity. (A) RAW264.7 cells were stimulated for the indicated times with 100 ng/ml LPS, 10 μM PGE2, or both LPS and PGE2. SIK2 was immunoprecipitated and the immunoprecipitate blotted with a phospho-PKA substrate Ab. In parallel the levels of SIK2, CRTC3 and ERK1/2 were determined by immunoblotting. Levels of phospho-PKA protein were quantified relative to total SIK2 protein and represented as a ratio of the unstimulated control. (B) RAW264.7 cells were labeled with SILAC medium and phosphoproteomics carried out on unstimulated, PGE2-, and LPS + PGE2-stimulated cells as described in Materials and Methods. Data for the phospho-peptide corresponding to Ser343 on SIK2 is shown. (C) U2OS cells were transfected with mCherry-CRTC3 and either SIK2 or S343A SIK2 expression constructs. Cells were stimulated with 50 μM forskolin for 30 min and fixed, and CRTC3 localization was examined. DAPI (DNA) staining is shown in blue and mCherry-CRTC3 in red (original magnification ×100; image width is 110.2 μ). (D) Hek293 cells were transfected with the indicated expression constructs. Cells were either left unstimulated, stimulated with 50 μM forskolin for 30 min, or incubated with 10 μM H89 for 1 h and then stimulated with forskolin. Lysates were then blotted with Abs against either GFP, SIK2, phospho-Ser343 SIK2, or with a phospho-PKA substrate Ab. Levels of phospho-PKA and phospho-Ser343 SIK2 protein were quantified relative to total SIK2 protein and represented as a ratio of the unstimulated control. (E) Hek293 cells were transfected with a CREB-dependent luciferase reporter in combination with either an empty expression vector or expression vectors for GFP, wild-type GPF-tagged SIK2, or Ser343Ala GFP-tagged SIK2. Cells were either left unstimulated or stimulated with 50 μM forskolin to induce PKA activation for 4 h. Error bars represent the SEM of four stimulations. The results are representative of two independent experiments. For the forskolin stimulation, n.s. represents a nonsignificant difference (p > 0.05, Student t test). *p < 0.05, **p < 0.01 (Student t test).

