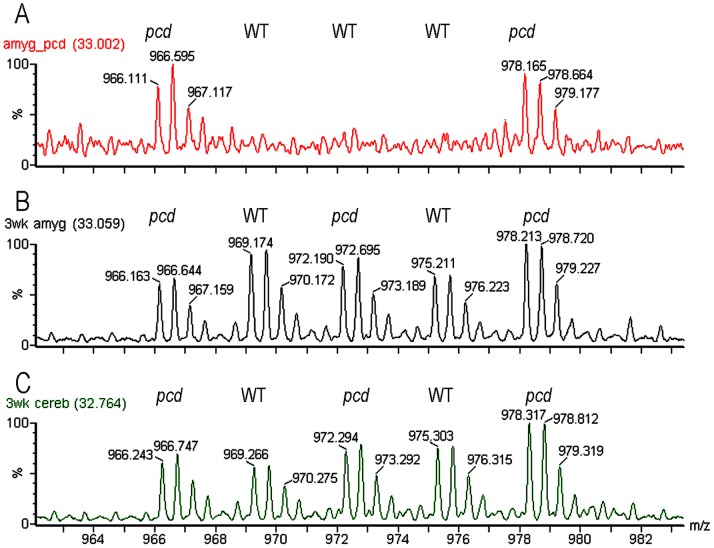
Figure 1. Representative data of quantitative peptidomics approach to measure changes in peptide levels in pcd mice, relative to WT mice.
Representative spectra show the 2+ ions for the D0 to D12-TMAB peaks of the peptide subsequently identified by MS/MS as the N-terminal fragment of prefoldin 1, Ac-AASVDLELKKAFTEL, with TMAB tags on the two Lys residues. A, three different adult WT mice (labeled with D3-, D6-, and D9-TMAB) and two adult pcd mice (labeled with D0- and D12-TMAB). B, amygdala from 3 week old mice. C, cerebellum from 3 week old mice. For B and C, WT tissue was labeled with D3- and D9-TMAB, pcd tissue was labeled with D0-, D6-, and D12-TMAB.

