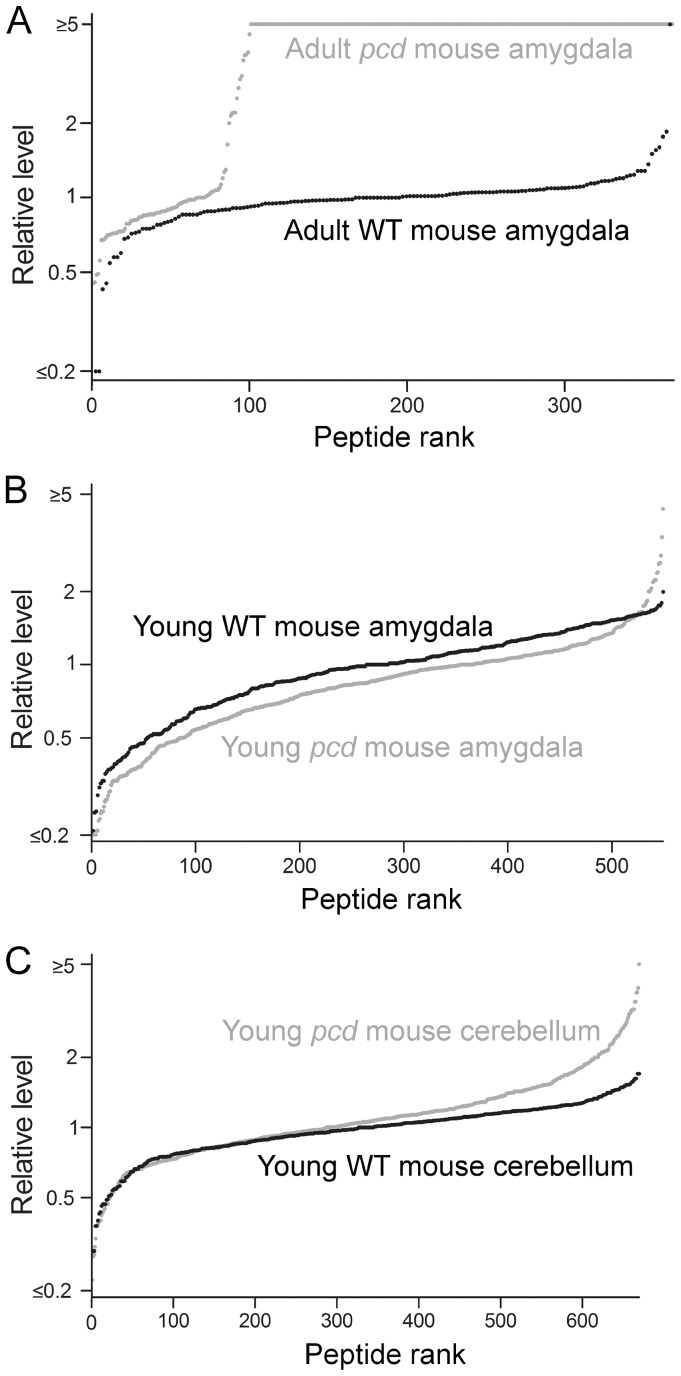
Figure 3. Levels of intracellular peptides in the brain of young WT and pcd mice.
The levels of peptides derived from intracellular proteins were studied using quantitative peptidomics. The relative levels of peptides in WT mice (black circles) and pcd mice (grey circles) are indicated for (A) amygdala of adult mice; (B) amygdala of 3-week old mice; and (C) cerebellum of 3-week old mice. Each dot in the graph shows the ratio between a peptide in one WT or pcd replicate versus the average level in the WT replicates. The x-axis reflects the number of peptides found in pcd mice. See Table S1 for data.

