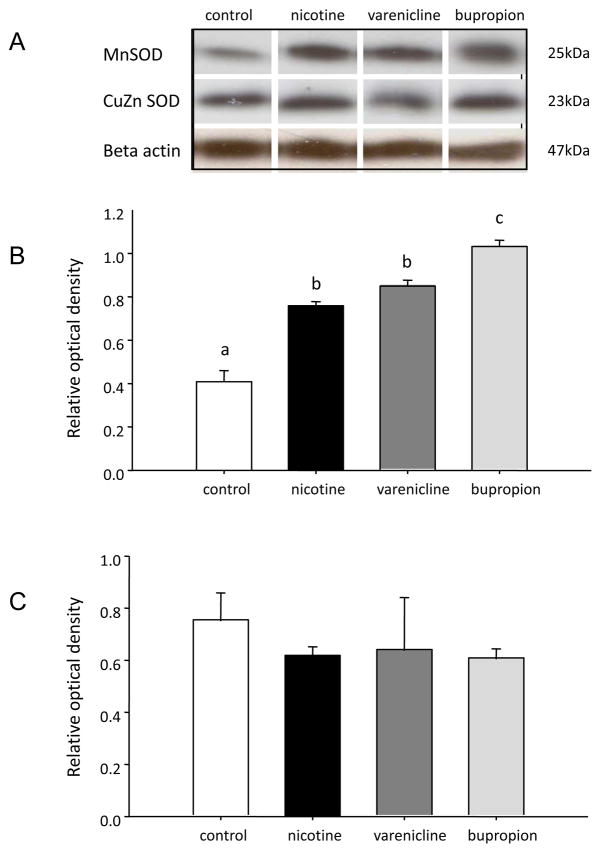
Figure 5.
Quantification of MnSOD and CuZn SOD in INS-1E cells treated with nicotine, varenicline or bupropion. A) Representative Western blot for each protein B) Quantification of protein expression of MnSOD. C) Quantification of protein expression of CuZnSOD. All protein expression was quantified relative to a β-actin loading control. Data are presented as mean ± SE (N=3). Values with different superscripts are significantly (p<0.05) different from each other.

