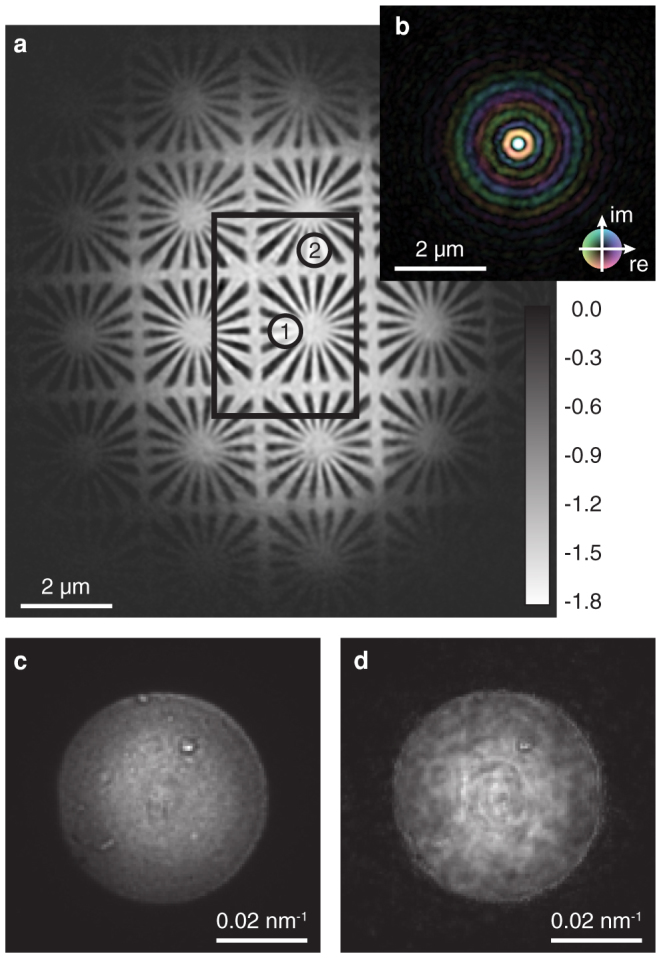
Figure 2. Numerically retrieved illumination and object function.

(a) Ptychographic reconstruction of the test object (phase shift in radian). All scan points lie within the black rectangle. Two specific diffraction patterns obtained from areas marked with numbers 1 and 2 are used to investigate pulse-to-pulse fluctuations of the nanofocused X-ray beam. (b) Reconstructed average illumination function is shown on the same length scale. The amplitude is encoded by brightness and the phase by hue. (c) Measured far-field image of the focused beam without any sample in the beam. (d) Far-field image calculated from the reconstructed wave field.
