
Figure 3. Complex wave field propagated ±15 mm along the optical axis.
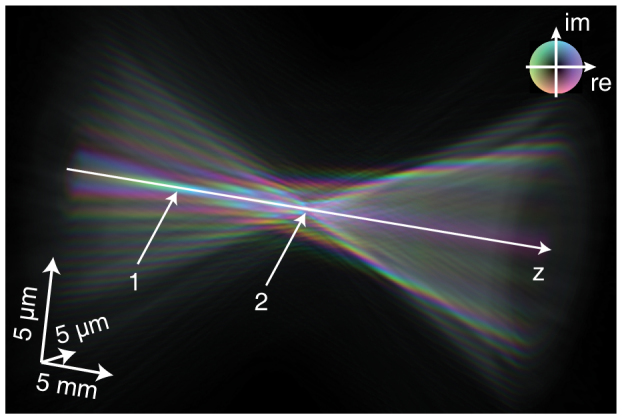
The colors indicate the local phase as illustrated in the inset. Amplitude is encoded by brightness.
Official websites use .gov
A
.gov website belongs to an official
government organization in the United States.
Secure .gov websites use HTTPS
A lock (
) or https:// means you've safely
connected to the .gov website. Share sensitive
information only on official, secure websites.
The colors indicate the local phase as illustrated in the inset. Amplitude is encoded by brightness.