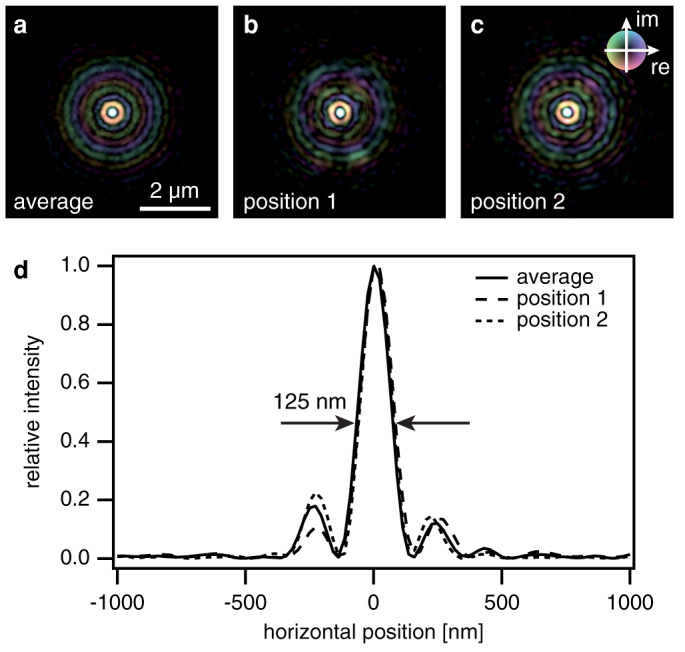
Figure 4. Comparison of illumination functions retrieved from a single diffraction pattern (single pulse) and multiple diffraction patterns (average).

(a) Reconstructed average wave field in the sample plane. (b), (c) Wave fields obtained from a single diffraction pattern measured at position 1 and 2 as indicated in Fig. 2 (a). (d) Intensity profiles through the focus for the average and individual wave fields presented above, showing both the individuality of single pulses and the similarity to the reconstructed average wave field. The phase is coded according to the color wheel.
