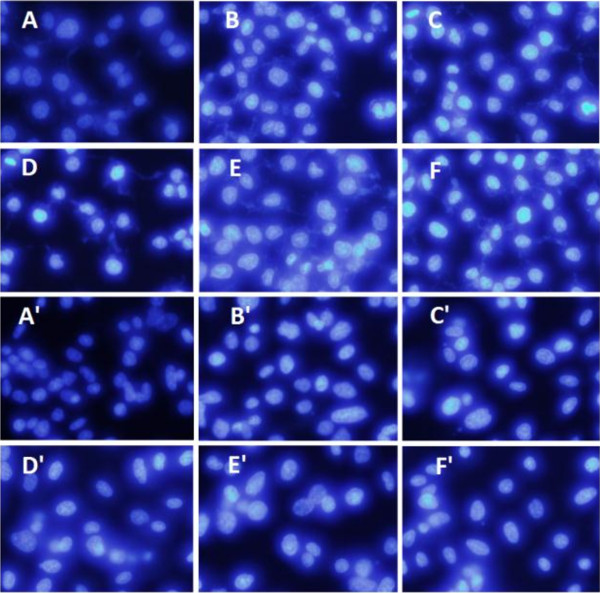
Figure 3.
Results from the Hoechst 33258 staining. For MGC-803 cells group, A: negative control; B: positive control, treated with HCPT (20 μM) for 48 h; C, D: treated with BTA (20 μM) for 24, 48 h; E, F: treated with OEA (20 μM) for 24, 48 h. For PC3 cells group, A’: negative control; B’: positive control, treated with HCPT (20 μM) for 48 h; C’, D’: treated with BTA (20 μM) for 24, 48 h; E’, F’: treated with OEA (20 μM) for 24, 48 h

