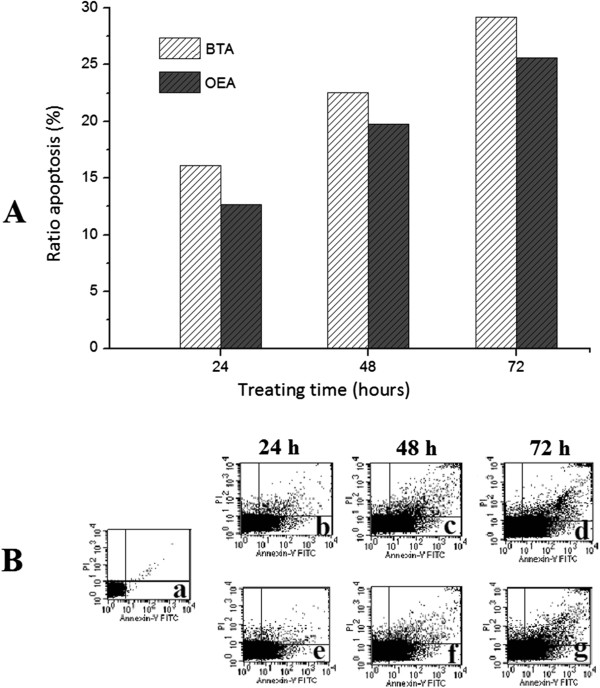
Figure 5.
Flow cytometry analysis. A: the apoptosis ratios of MGC-803 cells treated with BTA and OEA (20 μM) assessed by flow cytometry. B: flow cytometry analysis for apoptosis inducing activities of BTA and OEA on MGC-803 cells, a: control; b, c, and d: treated with BTA (20 μM); e, f, and g: treated with OEA (20 μM)

