
Figure 1.
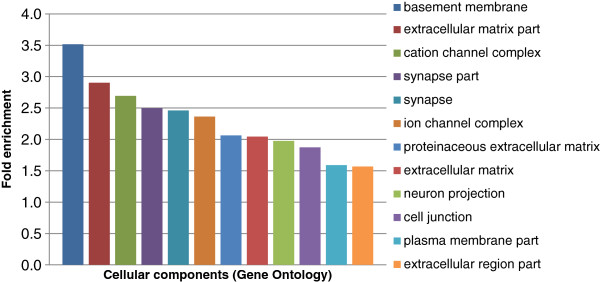
Enriched cellular components of HI gene products. The horizontal axis represents enriched classes of cellular components and the vertical axis represents the fold enrichment. Cellular components are colored and annotated to the right.
Official websites use .gov
A
.gov website belongs to an official
government organization in the United States.
Secure .gov websites use HTTPS
A lock (
) or https:// means you've safely
connected to the .gov website. Share sensitive
information only on official, secure websites.
Enriched cellular components of HI gene products. The horizontal axis represents enriched classes of cellular components and the vertical axis represents the fold enrichment. Cellular components are colored and annotated to the right.