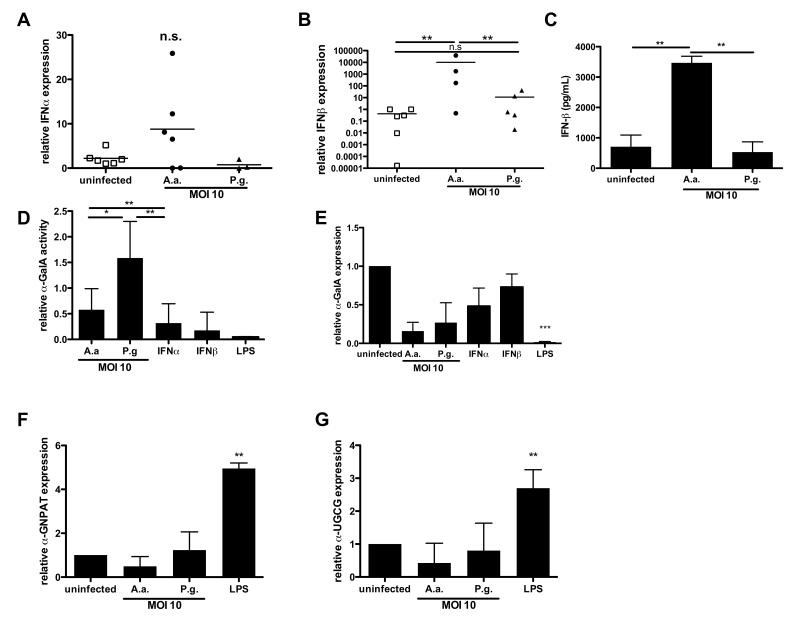
Fig.5. A.a. and P.g. differ in the ability to stimulate IFN-β production and disrupt GSL turnover.
A. Murine BMDCs were infected with A.a. or P.g. (MOI 10) or left unstimulated for 24 hrs. A./B. Graphs show IFN-α and IFN-β mRNA expression relative to untreated DCs, obtained from at least three independent experiments and analyzed by real-time PCR. C. IFN-β concentrations in cell culture supernatants of BM-DCs infected as in A. D. Enzyme activity of α-GalA in DCs after infection with A.a. or P.g. (MOI 10), or culture in the presence of endotoxin-free IFN-α or IFN-β (both at 1 U/ml), or LPS. Enzymatic activity was measured in DC lysates using a fluorogenic α-GalA substrate. Graph shows relative activity compared to untreated DCs (n=3). E-G. mRNA expression of mRNA transcripts (E: α-GalA, F: glyceronephosphate O-acyltransferase, G: ceramide glucosyltransferase) in DCs after infection with A.a. or P.g. (MOI 10), or culture in the presence of IFN-α, IFN-β, or LPS, respectively. *, p<0.05; **, p<0.01; n.s, not significant.

