Abstract
Purpose
To quantify B1+ variation across the breasts and to evaluate the accuracy of pre-contrast T1 estimation with and without B1+ variation in breast MRI patients at 3T.
Materials and Methods
B1+ and variable flip angle (VFA) T1 mapping were included in our dynamic contrast-enhanced (DCE) breast imaging protocol to study a total of 25 patients on a 3.0T GE MR 750 system. We computed pre-contrast T1 relaxation in fat, which we assumed to be consistent across a cohort of breast imaging subjects, with and without compensation for B1+ variation. The mean and standard deviation of B1+ and T1 values were calculated for statistical data analysis.
Results
Our measurements showed a consistent B1+ field difference between the left and right breasts. The left breast has an average 15.4% higher flip angle than the prescribed flip angle, and the right breast has an average 17.6% lower flip angle than the prescribed flip angle. This average 33% flip angle difference, which can be vendor and model specific, creates a 52% T1 estimation bias in fat between breasts using the VFA T1 mapping technique. The T1 variation is reduced to 7% by including B1+ correction.
Conclusion
We have shown that severe B1+ variation over the breasts can cause a substantial error in T1 estimation between the breasts, in VFA T1 maps at 3T, but that compensating for these variations can considerably improve accuracy of T1 measurements, which can directly benefit quantitative breast DCE-MRI at 3T.
Keywords: Breast imaging, Quantitative DCE-MRI, B1 field inhomogeneity, T1 mapping, High-field MRI
INTRODUCTION
Dynamic contrast-enhanced MRI (DCE-MRI) is a widely used method in the diagnosis of breast cancer (1,2). The technique typically acquires a time series of T1-weighted images before and after injection of an intravenous low molecular-weight paramagnetic contrast agent, and can be used to characterize lesions of breast tissue. Quantitative microvascular properties can also be extracted by either fitting the gadolinium concentration curve to a pharmacokinetic model (3) or computing initial area under the gadolinium concentration curve (4). Both high spatial and high temporal resolution are important to accurately estimate these quantitative properties, which can potentially provide predictive, prognostic and pharmacodynamic response biomarkers for cancers (5-7).
An image of pre-contrast T1 values, registered to the dynamic series, is necessary to convert the dynamic MR data into the gadolinium concentration, where the concentration changes over time can be used to extract quantitative or semi-quantitative microvascular properties (8). One common method to measure T1 is variable flip angle (VFA) imaging, also known as Driven Equilibrium Single-Pulse Observation of T1 (DESPOT1), which uses several short TR RF-spoiled gradient-echo (SPGR) acquisitions with varying flip angles (9-11). The VFA method is highly time efficient and allows rapid 3D volumetric T1 mapping with high resolution (9,12), using the same pulse sequence that is used for the DCE acquisition itself, thus avoiding registration and calibration differences.
Non-uniformity of the transmit radio frequency (B1+) field can cause the actual flip angle in tissue to be different from the prescribed or nominal flip angle. The B1+ inhomogeneity tends to become more severe for higher field strengths, and at 3 Tesla, noticeable B1+ variation over the chest has been observed by many studies (13-16). The flip angle variation tends to be around 30 - 50% in the chest (13,14) and 40% across the breast (15,16), and can result in significant deviation in T1 measurements using VFA (17,18). Therefore, careful consideration of the B1+ inhomogeneity will be important to achieve accurate T1 mapping.
In this work, we measure B1+ inhomogeneity and pre-contrast T1 values to test the accuracy of VFA T1 mapping in the breast at 3T using the spatial consistency of T1 estimates of fat, derived from fat-only 2-point Dixon VFA images, as a metric of improvement. We quantify the B1+ inhomogeneity in a total of 25 breast MRI patients at 3T and evaluate the accuracy of the T1 measurements with and without compensation for B1+ variation by comparing T1 relaxation times in fat between breasts as well as with a previously-reported value of the breast at 3T.
MATERIALS AND METHODS
Experiments were performed on a 3.0T GE MR 750 system (GE Healthcare, Waukesha, WI). A body coil was used for RF transmission and a commercially available 8-channel high-density breast array coil (GE Healthcare, Waukesha, WI) was used for signal reception. No parallel imaging was used. The automatic pre-scan, provided by the scanner, was used to calibrate the RF transmission gain, and the difference in nominal transmit gains between T1 and B1+ measurements was applied to achieve a consistent flip angle variation between two sequences.
The B1+ measurement sequence and the T1 VFA measurement sequence were performed as part of our standard clinical breast DCE-MRI protocol. Although other faster alternatives for B1+ mapping exist, we used a double angle method (DAM) to measure flip angle variation (19,20), as it is robust. We acquired both measurements in a total of 25 women undergoing clinically indicated breast MRI for a history of known or suspected breast disease, ranging in age between 26 and 73 years (age = 50.1 ± 11.4 years and mass = 62.4 ± 10.8 kg). The axial orientation was chosen for both measurements as it is commonly used in breast MRI, and a large B1+ variation is expected from left to right. This retrospective review and analysis of the B1+ and T1 VFA data was performed in accordance with a protocol approved by our Institutional Review Board. More details on both measurement sequences are described below.
T1 Measurements - Variable Flip Angle (VFA)
In VFA T1 mapping, the measured signal intensity using SPGR (SSPGR) can be used to compute a T1 value in a linear form:
| [1] |
where α is the flip angle, E1 = e−TR/T1 and M0 is the longitudinal magnetization. By applying different flip angles αn, we can generate different points (SSPGR/sinαn,SSPGR/tanαn) in the linearized form. The slope E1 can then be estimated by linear regression, and T1 can be extracted from E1 using:
| [2] |
Note that Eq. [[2] is highly sensitive to any possible errors on the linear regression. Any perturbation on flip angles αn can degrade the slope estimation, and for example, +1% and −1% errors in the slope can range T1 to be from 200 ms to 2000 ms, when the actual T1 is 370 ms (TR = 4.5 ms).
T1 maps were measured by using a 3D SPGR sequence with a dual-echo bipolar readout, where TEs were chosen to be in- and out-of-phase images (TE = 1.2/2.4 ms). A two-point Dixon fat-water separation algorithm was used to generate fat-only and water-only images (21), which can eliminate partial volume effects of the admixture of fat and glandular tissue in breasts (22). We placed the T1 mapping before the pre-contrast T1-weighted imaging and selected two flip angles to be 5° and 10°, which were optimized to symmetrically sample the signal curve of fat (T1 was assumed to be 400 ms and TR = 4 ms in numerical simulation). We used T1 measurements on the lipid component in fat and compared T1 relaxation in fat with and without compensation for B1+ variation. Other imaging parameters were as follows: acquisition matrix size = 256×128×88, slice thickness = 4.2 mm, FOV = 32 cm, and total scan time = 20 sec.
B1+ Measurements - Double Angle Method (DAM)
B1+ maps were measured by using a 2D multi-slice SPGR sequence with prescribed flip angles of α and 2α (α = 60°). The actual flip angle map was calculated as
| [3] |
where Iα and I2α are the magnitude images nominal flip angles of α and 2α. Note that any image non-uniformities except for the flip angle variation are cancelled out here as they are identical for both magnitude images. B1+ mapping followed the DCE-MRI acquisition, and repetition time (TR) of 5 seconds was used to ensure complete T1 relaxation recovery of all tissue. Other imaging parameters were as follows: echo time (TE) = 2.5 ms, acquisition matrix = 64 × 64, number of slices = 49, slice thickness = 4 mm, field-of-view (FOV) = 44 cm, and total scan time = 9 min. Flip angle maps were computed using Eq. [3], and an error due to imperfect 2D slice profile was corrected by simulating the actual slice profile (23). We pre-computed a look-up table that corrects the slice profile errors based on the RF pulses (Hamming windowed sinc shape with different time-bandwidth products). An actual flip angle map can then be normalized by the prescribed flip angle (60°) to compute the relative flip angle variation in %.
Image Analysis
All image analysis both B1+ and T1 maps was performed on OsiriX, an open source image visualization software application (24). OsiriX supports a complete plug-in architecture and shares all the advanced features with any plug-in developments. We have developed OsiriX plug-ins to easily compute both B1+ and T1 maps, shown in Fig. 1, and freely available at http://bmr.stanford.edu/. We aligned the orientation and resampled the relative flip angle variation to match the number of slices with the VFA images (using the “Resample” function in OsiriX). T1 maps were computed using Eq. [2] with and without correcting B1+ variation. We only used central slices for comparison, to avoid effects from an imperfect 3D slab profile. We manually defined circular regions of interest (ROIs) covering medial and lateral portions of both left and right breasts based on magnitude fat-only images. We computed the mean and standard deviation (SD) across all 25 breast MRI patients and also drew box plots for data analysis (25).
Figure 1.
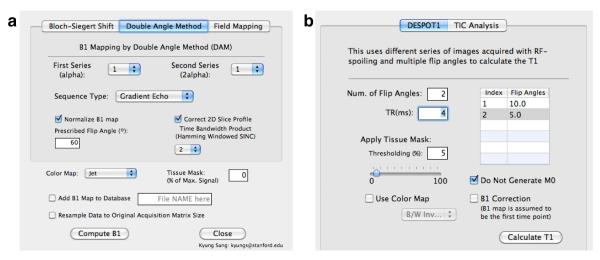
Screenshots of OsiriX plug-ins for (a) B1+ measurements and (b) T1 measurements. These plug-ins can allow easily computing all quantitative analysis and are freely available.
RESULTS
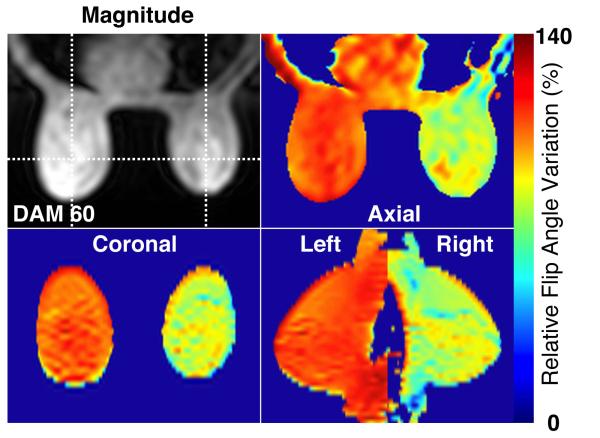
Figure 2 shows an example of relative flip angle distribution in three orthogonal planes (axial, coronal and sagittal). One of the DAM images (I60) is shown for the anatomical reference, and the coronal and sagittal planes are reformatted from 2D multi-slice images. In this subject, the left breast has an average 13% (± 4.3 %) higher flip angle than the prescribed flip angle, while the right breast has an average 20% (± 5 %) lower flip angle than the prescribed flip angle.
Figure 2.
An example of relative flip angle variation in percentage on a subject at 3T. One of the double angle method images is shown as an anatomical reference, and relative flip angle maps are shown in three orthogonal planes (axial, coronal, and sagittal).
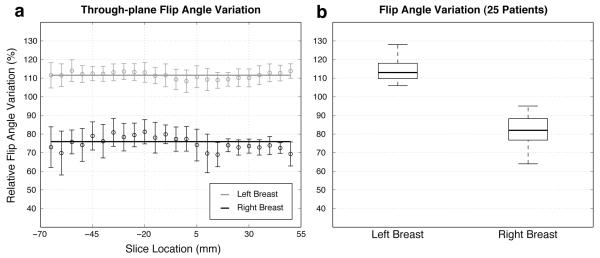
Figure 3a shows the mean and standard deviation of the relative flip angle variation across different slice locations (over a 11.5 cm range of axial slice locations) in a single subject. There exists a somewhat consistent flip angle difference between left and right breasts at all through-plane locations, and in this subject, the overall flip angle difference between the left and right breasts is approximately 35% (solid lines indicate the average relative flip angles of the left and right breasts). Figure 3b shows box plots (median, 25th and 75th percentiles, and lower and upper extremes) of the relative flip angle variation in all 25 breast MRI patients. The mean and standard deviation of the relative flip angle variation are 115.4 ± 9.3 (mean ± SD) % on the left breast and 82.4 ± 6.9% on the right breast, which conform to the literature (16).
Figure 3.
(a) Relative flip angle variation across through-plane slices (−65 mm – 50 mm) for one patient. (b) Comparison of flip angle variation in the left and right breasts in 25 breast MRI patients using a box plot. The central mark on each box is the median, the edges of the box are the 25th and 75th percentiles, and the “whiskers” extend to the most extreme data points that were not considered outliers.
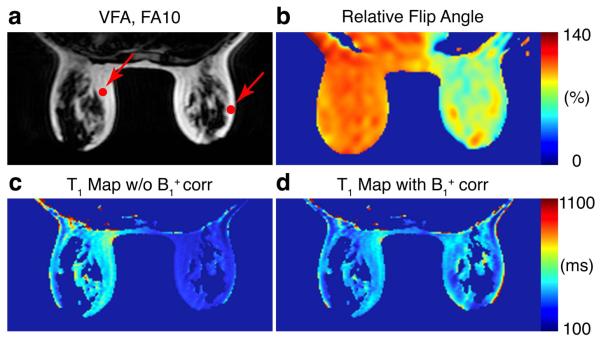
Figure 4 shows pre-contrast T1 values of fat with and without compensation for B1+ inhomogeneity in one subject. One of the fat only images (VFA, FA = 10°) and the relative flip angle map are displayed for the anatomical reference. The T1 map generated using the prescribed flip angles of 5° and 10° has a substantial T1 difference between the left and right breasts, while the B1+ compensated map shows more uniform fat T1 across the whole breast. Average fat T1 values over ROIs (see red dots in Fig 4) are 458 ms on the left ROI and 227 ms on the right ROI before B1+ correction, and become 387 ms on the left ROI and 323 ms on the right ROI after B1+ correction. The relative flip angle variation is 109% on the left ROI and 81% on the right ROI.
Figure 4.
(a) One of the VFA images and (b) relative flip angle map are shown as an anatomical reference. Comparison of T1 estimation of fat (c) without and (d) with correcting B1+ inhomogeneity.
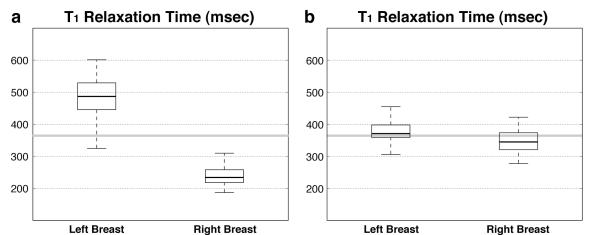
Figure 5 shows box plots (median, 25th and 75th percentiles, and lower and upper extremes) of T1 estimation of fat with and without compensation for B1+ variation in all 25 breast MRI patients. The estimated T1 values of fat without B1+ correction are 497.9 ± 112.1 ms on the left ROI and 239.0 ± 44.4 ms on the right ROI, while the estimated T1 values of fat with B1+ correction are 374.4 ± 44.8 ms on the left ROI and 346.5 ± 35.1 ms on the right ROI. The T1 difference between the left and right ROIs is 52% and is reduced to 7% after correcting for the B1+ variation. More importantly, the estimated fat T1 values with B1+ correction are close to the literature-reported value (T1 = 366 ms and solid gray lines in Fig 5) (22).
Figure 5.
Comparison of T1 estimation in fat (a) without and (b) with correction of B1+ inhomogeneity in 25 breast MRI patients. The literature-reported fat T1 value is shown as a solid gray line.
DISCUSSION
We have measured B1+ inhomogeneity over the breast in 25 breast MRI patients and have shown improved T1 measurements by accounting for B1+ variation in 3T breast imaging. Average relative flip angle variations were 115% (on the left breast) and 82% (on the right breast), where the overall difference between two breasts was approximately 35% and confirms to the literature (16). This flip angle difference mainly caused a 52% T1 estimation bias, as measured in fat, between the left and right breasts, and we were able to reduce this estimation error to 7% by including B1+ correction.
We assumed the T1 relaxation times in fat to be globally uniform and used the estimated fat T1 fat as a reference to demonstrate a T1 measurement bias. Corrected T1 values in fat are 374 ms (on the left breast) and 347 ms (on the right breast), which are close to the literature-reported value, 366 ms (22). There still exists a small residual difference between two breasts, and we believe the residual bias can be further reduced by increasing the number of flip angles in the T1 mapping (i.e., more than two flip angles).
Two flip angles in VFA T1 mapping may not be enough to accurately measure T1 due to its distinctive flip angle variation between two breasts at 3T. A set of flip angles can be optimized by accounting for the typical patterns of B1+ variation in the breast. The overall flip angle difference between the left and right breasts is relatively consistent among the patients, as shown in Fig 3, and we can design two different sets of flip angles (one for the left and the other for the right) by coarsely assuming the expected flip angle variation or can design a set of flip angles to make up for strong B1+ variations within one breast. We expect these approaches can be more useful for longer T1 values such as fibroglandular tissue T1, where the T1 estimation is known to be more sensitive to the flip angle variation.
Multi-channel parallel excitation techniques can be used to reduce the bias in T1 estimation due to B1+ inhomogeneity. A recent study has shown that dual-source excitation can improve B1+ inhomogeneity over conventional single-source excitation in breast MRI at 3T (26). This parallel excitation technique, however, requires special hardware equipment and can be vendor specific. In addition, the dual-source excitation can correct large first-order B1+ variations but can not solve all spatial variations, which may still cause a residual bias in T1 estimation.
The effects of the T1 estimation bias can also be minimized by pursuing other alternative quantification options. New enhancement indices that are insensitive to the variation of pre-contrast T1 (T10) values and B1+ inhomogeneity have been proposed to quantify the contrast agent uptake in DCE-MRI (27). The study has shown that these new enhancement indices, derived from saturation-recovery snapshot-FLASH (SRSF) images, are considerably less affected by errors caused by variations in the T10 and B1+ inhomogeneity at the cost of longer total scan time than the enhancement ratio in breast DCE-MRI.
Our study has several limiations. Although the degree of the flip angle variation agrees with the previous literature (15,16), the observed patterns of B1+ variation can be vendor and model specific as our study was performed on a 3T GE MR scanner. In addition, we have shown that our B1+ correction scheme can improve the accuracy of T1 estimation, but this correction scheme can propagate noise to the T1 estimation, which might make it less useful in low-SNR protocols. Other B1+ mapping methods (28-30) that are fast and can provide an improved angle-to-noise ratio can be considered to reduce the total scan time and error propagation.
In conclusion, we have shown that there exists a noticeable and somewhat systematic B1+ variation between the left and right breasts (average 33%) and have evaluated the accuracy of VFA T1 mapping with and without compensation for B1+ variation at 3T. The average difference in fat T1 between breasts was 52% in a total of 25 breast MRI patients, and we reduced this T1 estimation error to 7% by accounting for B1+ variation, where the fat T1 values are close to the literature-reported value. This improved T1 measurement scheme can benefit quantitative breast DCE-MRI at 3T.
Acknowledgments
Grant Sponsors: NIH R01-EB009055
NIH P41-EB015891
GE Healthcare
REFERENCES
- (1).Kuhl C. MRI of breast tumors. European radiology. 2000;10:46–58. doi: 10.1007/s003300050006. [DOI] [PubMed] [Google Scholar]
- (2).Hayes C, Padhani A, Leach M. Assessing changes in tumour vascular function using dynamic contrast-enhanced magnetic resonance imaging. NMR in Biomedicine. 2002;15:154–163. doi: 10.1002/nbm.756. [DOI] [PubMed] [Google Scholar]
- (3).Tofts PS, Brix G, Buckley DL, Evelhoch JL, Henderson E, Knopp MV, Larsson HBW, Lee TY, Mayr NA, Parker GJM. Estimating kinetic parameters from dynamic contrast-enhanced T1-Weighted MRI of a diffusable tracer: Standardized quantities and symbols. J. Magn. Reson. Imaging. 1999;10:223–232. doi: 10.1002/(sici)1522-2586(199909)10:3<223::aid-jmri2>3.0.co;2-s. [DOI] [PubMed] [Google Scholar]
- (4).Evelhoch JL. Key factors in the acquisition of contrast kinetic data for oncology. J. Magn. Reson. Imaging. 1999;10:254–259. doi: 10.1002/(sici)1522-2586(199909)10:3<254::aid-jmri5>3.0.co;2-9. [DOI] [PubMed] [Google Scholar]
- (5).Esserman L, Hylton N, Yassa L, Barclay J, Frankel S, Sickles E. Utility of magnetic resonance imaging in the management of breast cancer: evidence for improved preoperative staging. Journal of clinical oncology. 1999;17:110–110. doi: 10.1200/JCO.1999.17.1.110. [DOI] [PubMed] [Google Scholar]
- (6).Hawighorst H, Weikel W, Knapstein P, Knopp M, Zuna I, Schönberg S, Vaupel P, van Kaick G. Angiogenic activity of cervical carcinoma: assessment by functional magnetic resonance imaging-based parameters and a histomorphological approach in correlation with disease outcome. Clinical cancer research. 1998;4:2305–2312. [PubMed] [Google Scholar]
- (7).Zahra M, Hollingsworth K, Sala E, Lomas D, Tan L. Dynamic contrast-enhanced MRI as a predictor of tumour response to radiotherapy. The Lancet Oncology. 2007;8:63–74. doi: 10.1016/S1470-2045(06)71012-9. [DOI] [PubMed] [Google Scholar]
- (8).Larsson HBW, Stubgaard M, Frederiksen JL, Jensen M, Henriksen O, Paulson OB. Quantitation of blood-brain barrier defect by magnetic resonance imaging and gadolinium-DTPA in patients with multiple sclerosis and brain tumors. Magn. Reson. Med. 1990;16:117–131. doi: 10.1002/mrm.1910160111. [DOI] [PubMed] [Google Scholar]
- (9).Deoni SCL, Rutt BK, Peters TM. Rapid combined T1 and T2 mapping using gradient recalled acquisition in the steady state. Magn. Reson. Med. 2003;49:515–526. doi: 10.1002/mrm.10407. [DOI] [PubMed] [Google Scholar]
- (10).Brookes J, Redpath T, Gilbert F, Murray A, Staff R. Accuracy of T1 measurement in dynamic contrast-enhanced breast MRI using two-and three-dimensional variable flip angle fast low-angle shot. J. Magn. Reson. Imaging. 1999;9:163–171. doi: 10.1002/(sici)1522-2586(199902)9:2<163::aid-jmri3>3.0.co;2-l. [DOI] [PubMed] [Google Scholar]
- (11).Zhu X, Li K, KamalyAsl I, Checkley D, Tessier J, Waterton J, Jackson A. Quantification of endothelial permeability, leakage space, and blood volume in brain tumors using combined T1 and T2* contrast-enhanced dynamic MR imaging. J. Magn. Reson. Imaging. 2000;11:575–585. doi: 10.1002/1522-2586(200006)11:6<575::aid-jmri2>3.0.co;2-1. [DOI] [PubMed] [Google Scholar]
- (12).Wang H, Riederer S, Lee J. Optimizing the precision in T1 relaxation estimation using limited flip angles. Magn. Reson. Med. 1987;5:399–416. doi: 10.1002/mrm.1910050502. [DOI] [PubMed] [Google Scholar]
- (13).Greenman RL, Shirosky JE, Mulkern RV, Rofsky NM. Double inversion black-blood fast spin-echo imaging of the human heart: A comparison between 1.5T and 3.0T. J. Magn. Reson. Imaging. 2003;17:648–655. doi: 10.1002/jmri.10316. [DOI] [PubMed] [Google Scholar]
- (14).Sung K, Nayak KS. Measurement and characterization of RF nonuniformity over the heart at 3T using body coil transmission. J. Magn. Reson. Imaging. 2008;27:643–648. doi: 10.1002/jmri.21253. [DOI] [PubMed] [Google Scholar]
- (15).Kuhl CK, Kooijman H, Gieseke J, Schild HH. Effect of B1 inhomogeneity on breast MR imaging at 3.0 T. Radiology. 2007;244:929–930. doi: 10.1148/radiol.2443070266. [DOI] [PubMed] [Google Scholar]
- (16).Azlan CA, DiGiovanni P, Ahearn TS, Semple SIK, Gilbert FJ, Redpath TW. B1 transmission-field inhomogeneity and enhancement ratio errors in dynamic contrast-enhanced MRI (DCE-MRI) of the breast at 3T. J. Magn. Reson. Imaging. 2010;31:234–239. doi: 10.1002/jmri.22018. [DOI] [PubMed] [Google Scholar]
- (17).Treier R, Steingoetter A, Fried M, Schwizer W, Boesiger P. Optimized and combined T1 and B1 mapping technique for fast and accurate T1 quantification in contrast-enhanced abdominal MRI. Magn. Reson. Med. 2007;57:568–576. doi: 10.1002/mrm.21177. [DOI] [PubMed] [Google Scholar]
- (18).DiGiovanni P, Azlan C, Ahearn T, Semple S, Gilbert F, Redpath T. The accuracy of pharmacokinetic parameter measurement in DCE-MRI of the breast at 3 T. Physics in Medicine and Biology. 2010;55:121. doi: 10.1088/0031-9155/55/1/008. [DOI] [PubMed] [Google Scholar]
- (19).Insko EK, Bolinger L. B1 mapping. Proc., SMRM, 11th Annual Meeting; Berlin. 1992. p. 4302. [Google Scholar]
- (20).Stollberger R, Wach P, McKinnon G, Justich E, Ebner F. Rf-field mapping in vivo. Proc., SMRM, 7th Annual Meeting; San Francisco. 1988. p. 106. [Google Scholar]
- (21).Ma J. Breath-hold water and fat imaging using a dual-echo two-point dixon technique with an efficient and robust phase-correction algorithm. Magn. Reson. Med. 2004;52:415–419. doi: 10.1002/mrm.20146. [DOI] [PubMed] [Google Scholar]
- (22).Rakow-Penner R, Daniel B, Yu H, SawyerGlover A, Glover G. Relaxation times of breast tissue at 1.5 T and 3T measured using IDEAL. J. Magn. Reson. Imaging. 2006;23:87–91. doi: 10.1002/jmri.20469. [DOI] [PubMed] [Google Scholar]
- (23).Schär M, Vonken E, Stuber M. Simultaneous B0-and B1+-map acquisition for fast localized shim, frequency, and RF power determination in the heart at 3 T. Magn. Reson. Med. 2010;63:419–426. doi: 10.1002/mrm.22234. [DOI] [PMC free article] [PubMed] [Google Scholar]
- (24).Rosset A, Spadola L, Ratib O. OsiriX: an open-source software for navigating in multidimensional DICOM images. J Digit Imaging. 2004;17:205–216. doi: 10.1007/s10278-004-1014-6. [DOI] [PMC free article] [PubMed] [Google Scholar]
- (25).McGill R, Tukey JW, Larsen WA. Variations of box plots. American Statistician. 1978:12–16. [Google Scholar]
- (26).Rahbar H, Partridge SC, DeMartini WB, Gutierrez RL, Parsian S, Lehman CD. Improved B1 homogeneity of 3 tesla breast MRI using dual-source parallel radiofrequency excitation. J. Magn. Reson. Imaging. 2012;35:1222–1226. doi: 10.1002/jmri.23571. [DOI] [PMC free article] [PubMed] [Google Scholar]
- (27).Azlan CA, Ahearn TS, DiGiovanni P, Semple SIK, Gilbert FJ, Redpath TW. Quantification techniques to minimize the effects of native T1 variation and B1 inhomogeneity in dynamic contrast-enhanced MRI of the breast at 3 T. Magn. Reson. Med. 2011;67:531–540. doi: 10.1002/mrm.23021. [DOI] [PubMed] [Google Scholar]
- (28).Cunningham CH, Pauly JM, Nayak KS. SDAM: Saturated double angle method for rapid B1+ mapping. Magn. Reson. Med. 2006;55:1326–1333. doi: 10.1002/mrm.20896. [DOI] [PubMed] [Google Scholar]
- (29).Yarnykh V. Actual flip-angle imaging in the pulsed steady state: a method for rapid three-dimensional mapping of the transmitted radiofrequency field. Magn. Reson. Med. 2007;57:192–200. doi: 10.1002/mrm.21120. [DOI] [PubMed] [Google Scholar]
- (30).Sacolick L, Wiesinger F, Hancu I, Vogel M. B1 mapping by Bloch-Siegert shift. Magn. Reson. Med. 2010;63:1315–1322. doi: 10.1002/mrm.22357. [DOI] [PMC free article] [PubMed] [Google Scholar]


