
Figure 4.
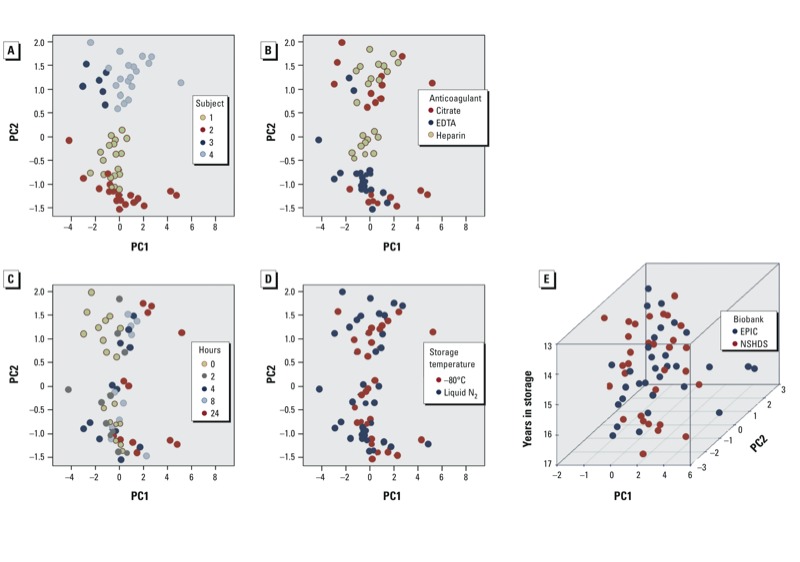
Proteomics. (A–D) Phase 1. PCA plot (proportion of variance explained: PC1, 56.4%; PC2, 25.0%) labeled for donor (A), storage temperature (B), bench times (C), anticoagulants (D). Because all samples were subjected to proteomic analyses, the points shown for each variable indicated include variation of the remaining variables. (E) PCA on storage time in the two biobanks.