
Figure 1.
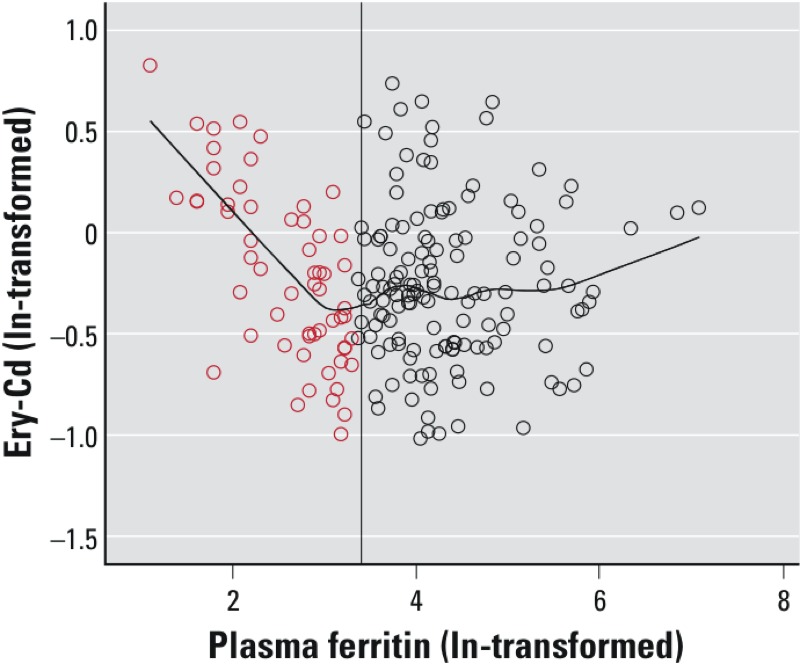
Scatter plot showing the association between estimated Cd in erythrocytes (ln-transformed, based on measured concentrations in whole blood) and plasma ferritin (ln-transformed) in Andean women. The reference line is drawn at 3.4, corresponding to a plasma ferritin concentration of 30 µg/L in normal scale. The fit line is calculated by the LOESS-method with biweight kernel in order to emphasize the relation between Ery-Cd and plasma ferritin. Red circles represent the subgroup considered to have low iron stores in this study.