
Figure 1.
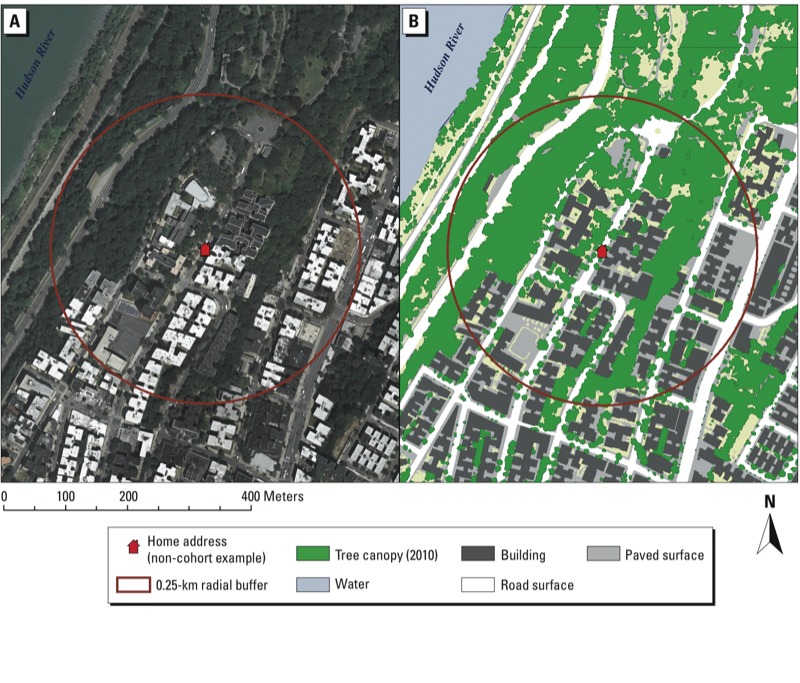
Circular buffer with tree canopy coverage shown using (A) orthophotography and (B) land use classification. The figure shows an example address within the study area (though for confidentiality reasons the address of a study participant was not used), surrounded by a 0.25-km radial buffer, to illustrate that tree canopy coverage was calculated as the percentage of land area within the circle classified as tree canopy. Data sources are described by MacFaden et al. (2012).