
Figure 1.
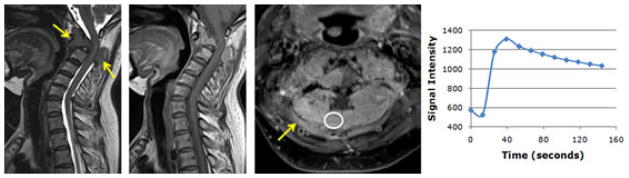
A 56-year-old female patient with confirmed pathological diagnosis of myeloma. A. MR T2WI and B. MR T1WI show steolytic destruction in the C1-3 vertebral body. A soft tissue mass around the vertebral canal compressing the vertebral body is shown. C. Contrast-enhanced MR T1WI shows a heterogeneously enhanced lesion. D. The DCE kinetics show rapid wash-in with a peak at 40 seconds, followed by wash-out. The peak SE% = 138%, steepest wash-in SE% = 114%, and wash-out SE% = 48%. From pharmacokinetic analysis, the fitted Ktrans = 0.069/min and kep = 0.96/min.