
Figure 5.
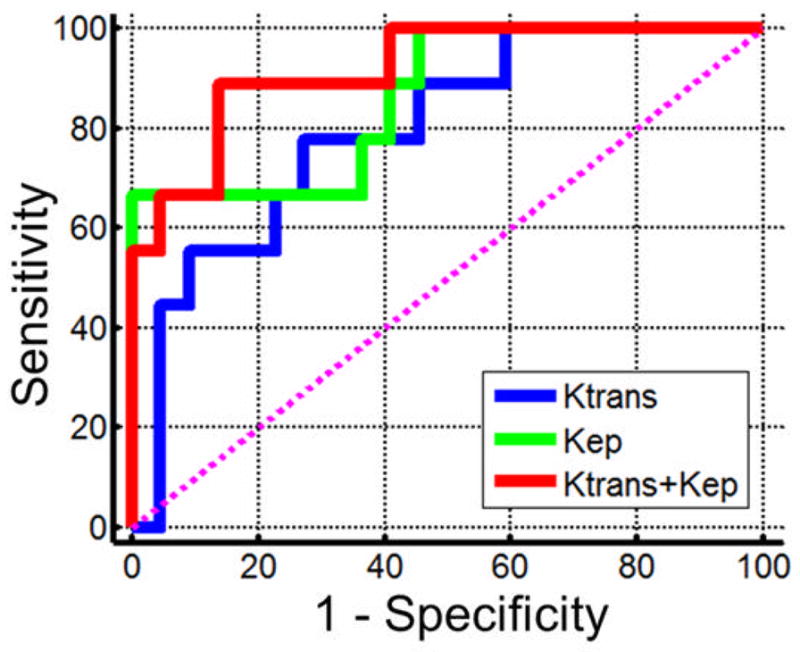
The ROC curves for differentiating between myeloma and metastatic cancer groups. The area under the curve is 0.798 for Ktrans, 0.864 for kep, and an increased 0.919 using combined Ktrans and kep.
Official websites use .gov
A
.gov website belongs to an official
government organization in the United States.
Secure .gov websites use HTTPS
A lock (
) or https:// means you've safely
connected to the .gov website. Share sensitive
information only on official, secure websites.
The ROC curves for differentiating between myeloma and metastatic cancer groups. The area under the curve is 0.798 for Ktrans, 0.864 for kep, and an increased 0.919 using combined Ktrans and kep.