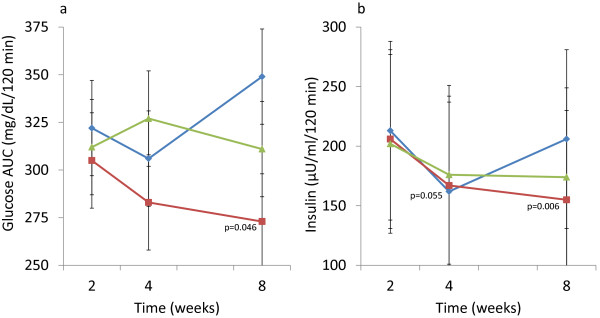
Figure 2.

Change in areas under the curve (AUC) over 8 weeks of intervention with Elaeis guineensis 500 mg/d (−−-♦---), Elaeis guineensis 1000 mg/d (−−-■---), and Ficus deltoidea 500 mg/d (−−-▲---). Points show the mean value each time point at which the measurement was taken, with vertical error-bars representing ± 1 SD. c. Glucose AUC (mg/dL/120 minutes) d. Insulin AUC (μU/mL/120 minutes).
