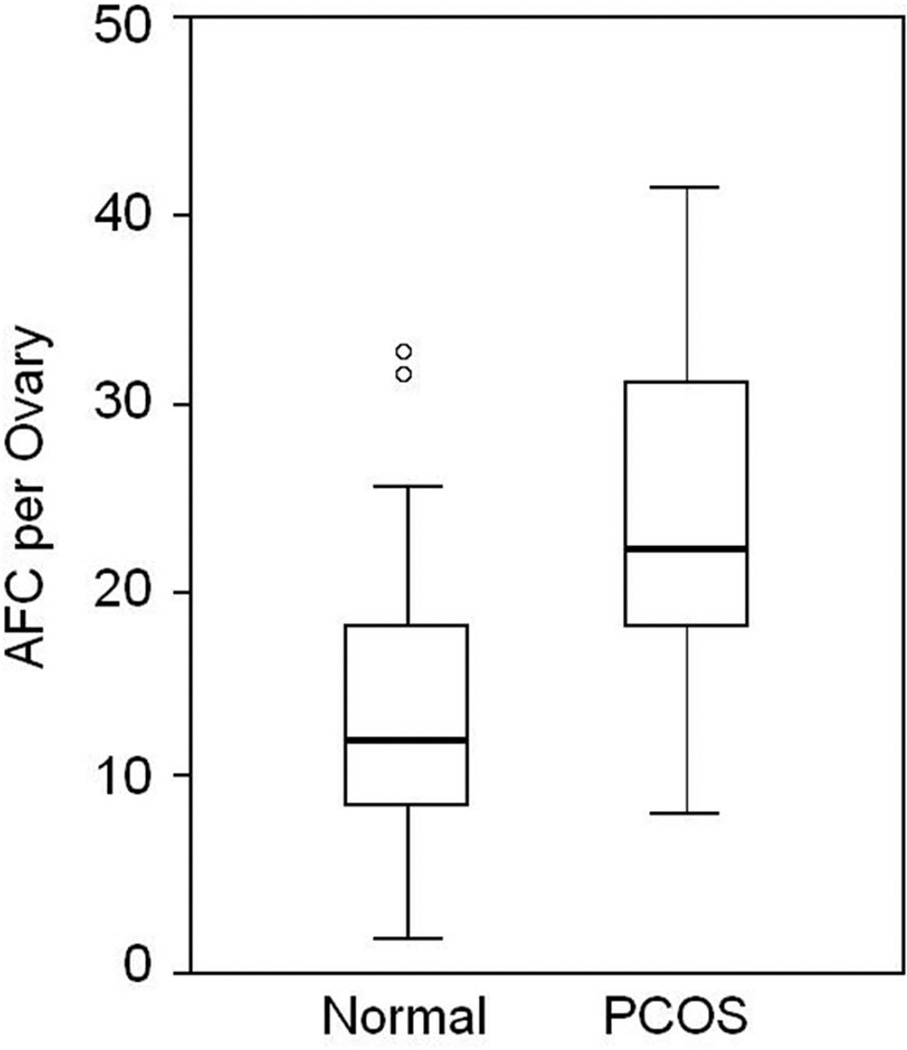
Figure 3.
Box-and-whisker plot showing follicle number per ovary (FNPO) in normal adolescent girls and adolescent girls with polycystic ovary syndrome (PCOS). Horizontal small bars represent the 5–95th percentile range and the boxes indicate the 25–75th percentile range. The horizontal line within each box corresponds to the median. O, values beyond the 95th percentile.

