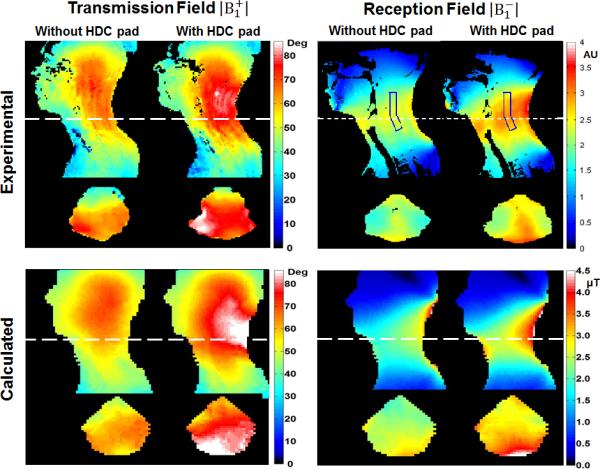
Figure 3.

The experimentally measured and numerically calculated and fields with and without the HDC pads in sagittal and axial views. For comparison purposes the experimental maps are normalized with the transmission voltage while the maps are normalized by the standard deviation of the “noise scan”. The calculated and maps are normalized by the input current in the conductor elements in the coil model. To correlate the enhancement with SNR in the corresponding region in Fig. 4, an ROI is selected in the spinal cord region. The average enhancement in the ROI is 29±5% (Mean ± SD).
