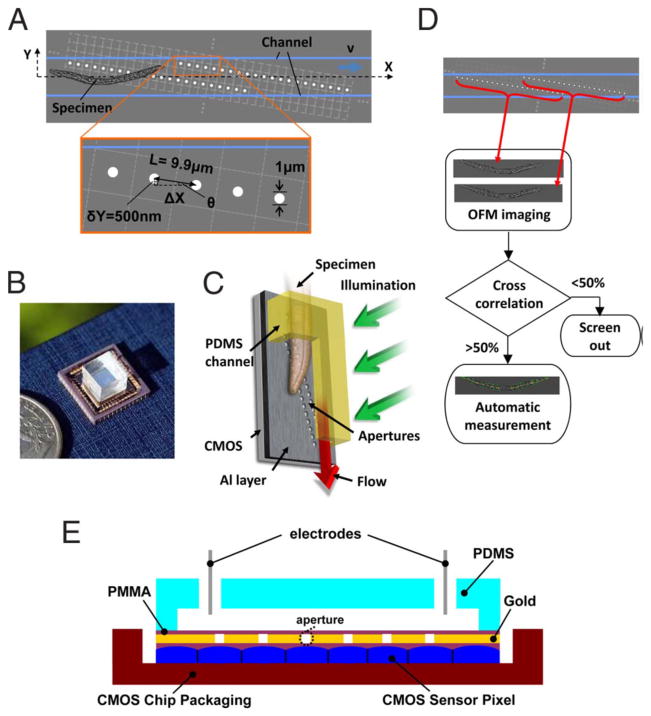
Fig. 15.
Optofluidic microscope (OFM) prototype. (A) Schematic top view of the OFM. The OFM apertures (white circles) are placed on the Al (gray) coated 2D CMOS image sensor (light gray dashed grid) and extend across the whole microfluidic channel. (B) The actual device next to a U.S. quarter. (C) Vertical operation mode. (D) Flow chart of the OFM operation. Two OFM images of the same C. elegans are acquired by the two OFM arrays as shown by the red arrows. If the correlation between the two images is <50%, these images are rejected. Otherwise, the area and the length of the worms are automatically determined. (E) Cross-sectional view of an electro-kinetically driven OFM device. [71] Copyright (2008) National Academy of Sciences, USA.

