


Fig. 2.
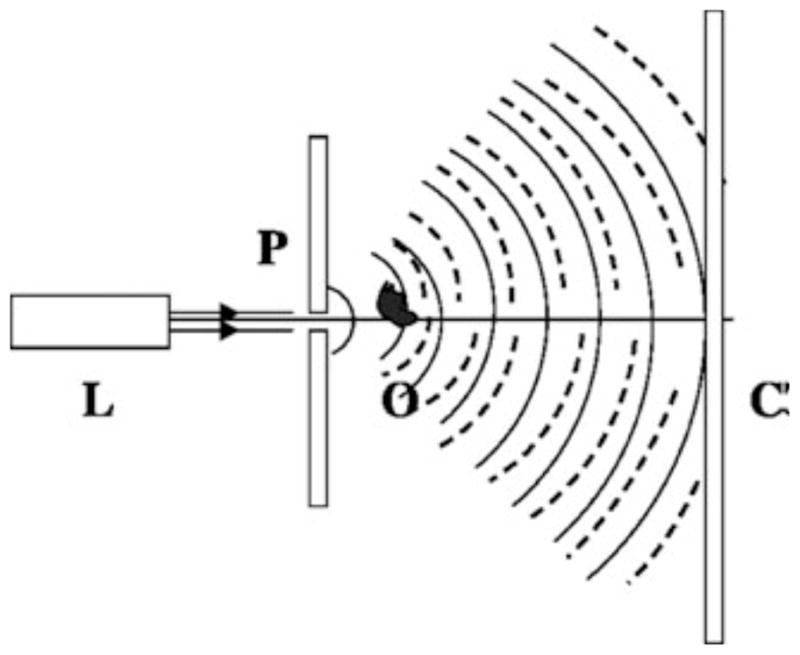
Sketch of a digital in-line holographic microscope. A laser (L) is focused onto a submicron pinhole (P) so that the emerging wave illuminating the object (O) is spherical. The resulting interference pattern or hologram is recorded on the screen (C) with a typical fringe magnification of ~10–35. The solid and dashed lines represent the reference wave and the scattered object wave, respectively. Reprinted from [27] with permission from OSA.