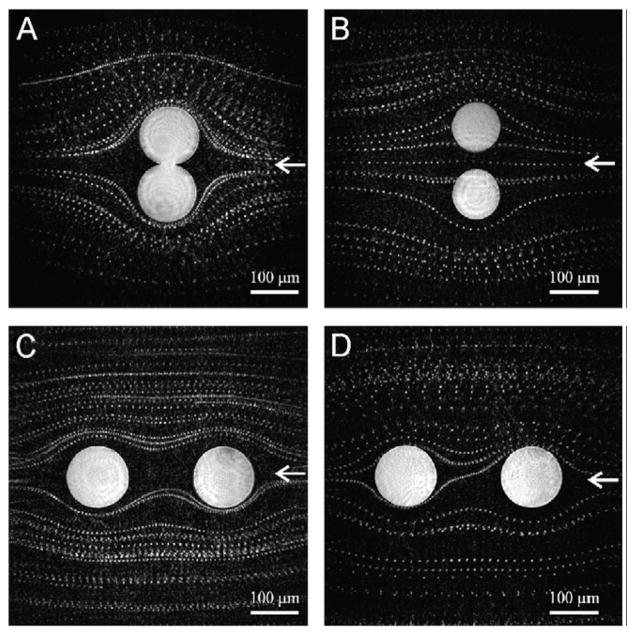
Fig. 5.
Fluid flow visualization using bovine red blood cells with DIHM. The liquid is coming from the direction of the arrows, and is flowing around two fixed spheres in different geometries. Reconstructions are made from difference holograms composed of 100 holograms taken at 10 frames per second, using a green laser that illuminates a 1 μm pinhole. The pinhole to sample distance is 1 mm and the NA is 0.25. Reprinted from [47] with permission from Elsevier copyright (2008).

