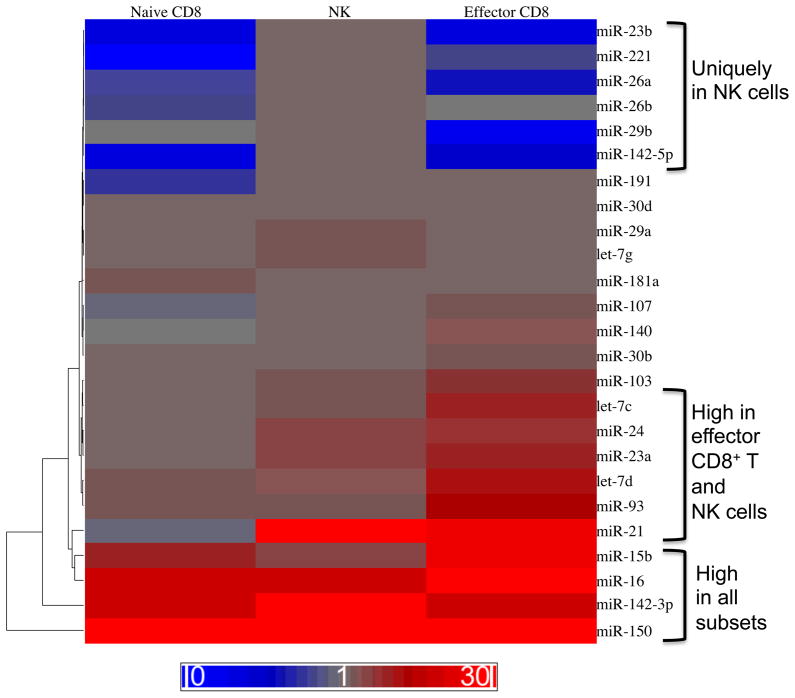
Fig. 5. Common miRNA expression programs between NK and CD8+ T-cell populations.
miRNAs expressed in resting NK cells as compared to resting (naive) CD8+ T cells or effector CD8+ T cells. NK1.1+ TCRβ− NK cells were sorted from C57BL/6 mice. Naive CD8+ T cells were sorted from CD45.1+CD45.2+ P14 mice bearing the DbGP33-specific TCR. Effector CD8+ T cells were sorted from chimeric mice generated by adoptive transfer of P14 T cells into C57BL/6 (CD45.2+) recipients that were infected intraperitoneally with 2 × 10⁵ plaque forming units (PFU) of LCMV Armstrong. Levels of mature miRNAs were measured by qRT-PCR and normalized to sno202. Fold expression relative to sno-202 is depicted as a heat map. Three patterns

