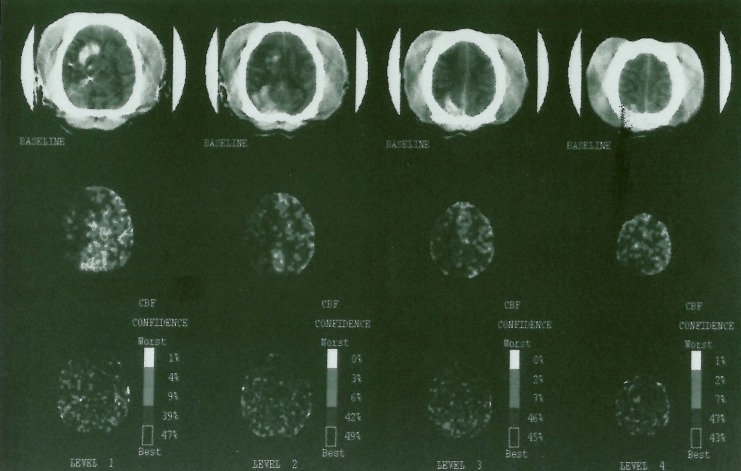
Figure 3.
Stable Xenon-CT scan showing axial images with corresponding blood flow maps. Right MCA distribution hypodensity can be seen to correlate with low to absent flows on the blood flow maps in the MCA regions. The high density areas in the right hemisphere represent contrast extravasation in a hyperacute stroke. These are as are not hemorrhagic as was confirmed at autopsy.

