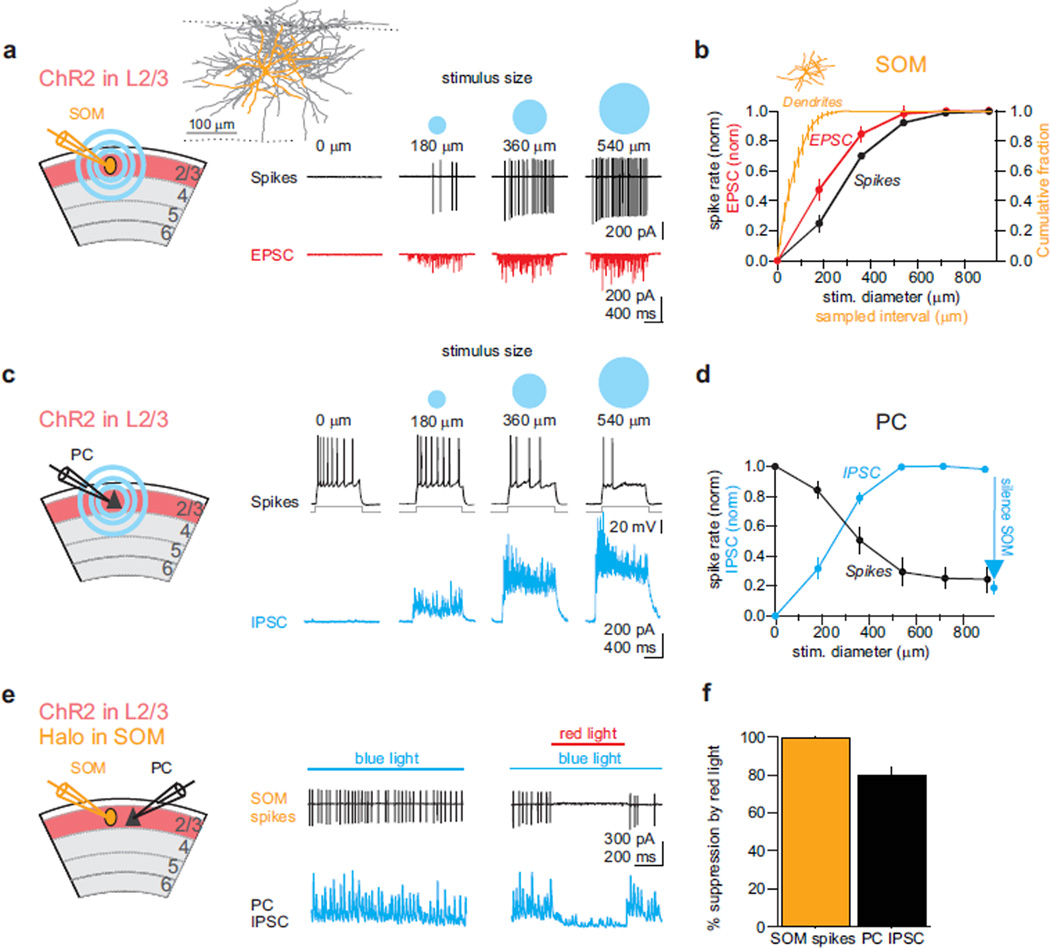
Fig. 3. Suppression of PCs by SOMs as a function of the activated layer 2/3 area.
a) Left: Schematic of the experimental setup Inset: Anatomical reconstruction of a biocytin-filled layer 2/3 SOM; dendrites: orange; axon: gray; dotted lines: top: border with layer 1; bottom: border with later 4. Right: Action potentials (black traces, top) recorded in the cell-attached mode in a SOM in response to light spot sizes of increasing diameter. Bottom: Excitatory currents (red traces) recorded subsequently in the whole cell voltage clamp configuration in the same SOM neuron in response to the same photo-stimuli.
b) Summary graph for the spiking (black; n =14) and excitatory charge (red; n=6) of SOMs in response to light spots of five different diameters. Orange: summary statistics of the cumulative fraction of SOM dendritic arbor length within a sampled horizontal interval centered on the SOM cell body (n = 6). Inset: dendrites of the SOM illustrated in (a) but scaled to x-axis.
c) Left: Schematic of the experimental setup. As in (a) but recording from PC. Right, top: Spiking of PC recorded in current clamp mode (black traces) in response to depolarizing current steps while layer 2/3 is photo-stimulated with increasingly large blue light spots. Bottom: Inhibitory currents recorded in a PC to the same light stimuli.
d) Summary graph of the suppression of firing of PCs (black, n=7) and intracellularly recorded inhibitory charge (blue, n=6) to light spots of five different diameters. Photo-hyperpolarizing SOMs (blue arrow; see (e) below) reduces inhibitory charge in PCs.
e) Schematic of the experimental setup. ChR2 is expressed in a fraction of layer 2/3 PCs and halorhodopsin is conditionally expressed in SOMs. Recording electrodes target a SOM (orange) and a PC (black). Full field blue light activates layer 2/3 PCs, while red light suppress SOMs. Traces: Spikes (black traces, top) recorded in the cell-attached mode in a SOM and inhibitory currents (blue traces, bottom) simultaneously recorded in a voltage clamped PC in response to blue light photo-stimulation (blue bar) of layer 2/3. Simultaneous illumination with red light (red bar, right panel) to photo-hyperpolarize SOMs abolishes SOM firing (left) and reduces inhibitory currents in the PC (right; see also blue arrow in (d)).
f) Summary graph for halorhodopsin-mediated reduction of SOM firing (n=6) and concomitant reduction in inhibitory charge (IPSC) in layer 2/3 PCs (n=8).

