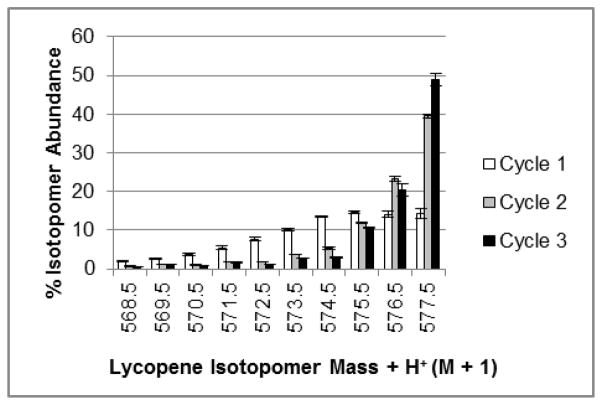
Figure 2.
Isotopomeric distribution of 13C-enriched lycopene over three serial growth cycles. Bars represent the percent of enriched lycopene present as a specific isotopomer, out of all possible 13C isotopomers detected in positive ion mode [m/z 537.5 (M+H++0) – m/z 577.5 (M+H++40)]. Here the M+H++30 – M+H++40 isotopomers are represented. Data represent the average of five trials with one analysis/trial, and error bars represent the standard error of the mean.

