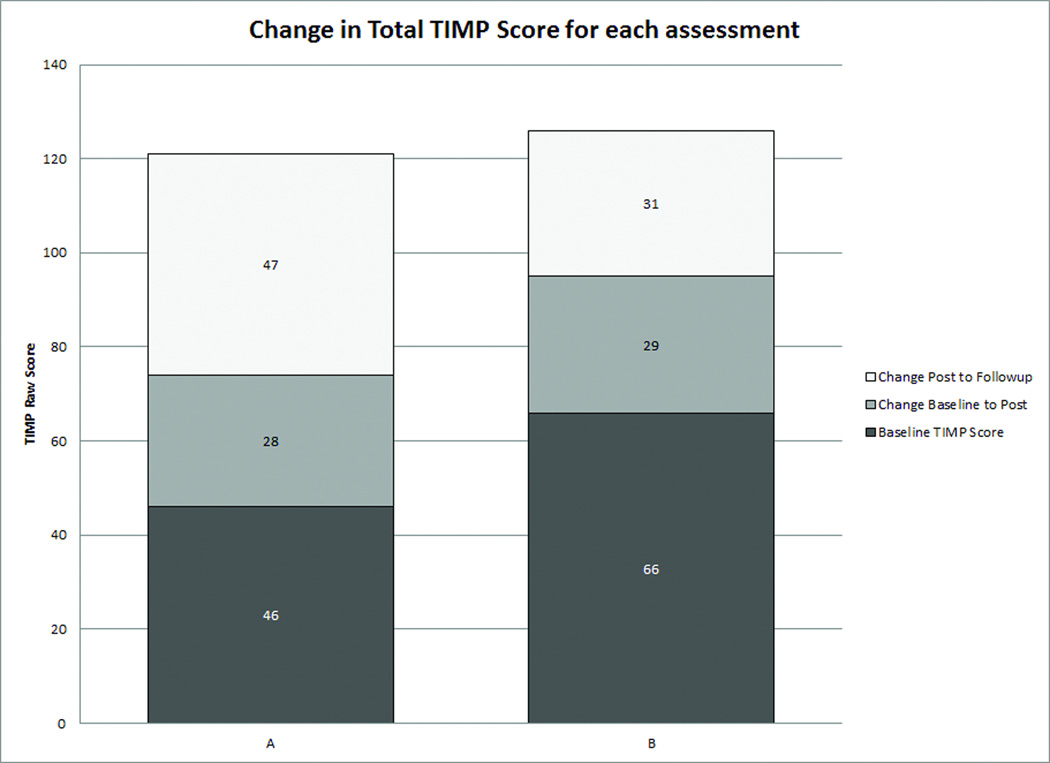
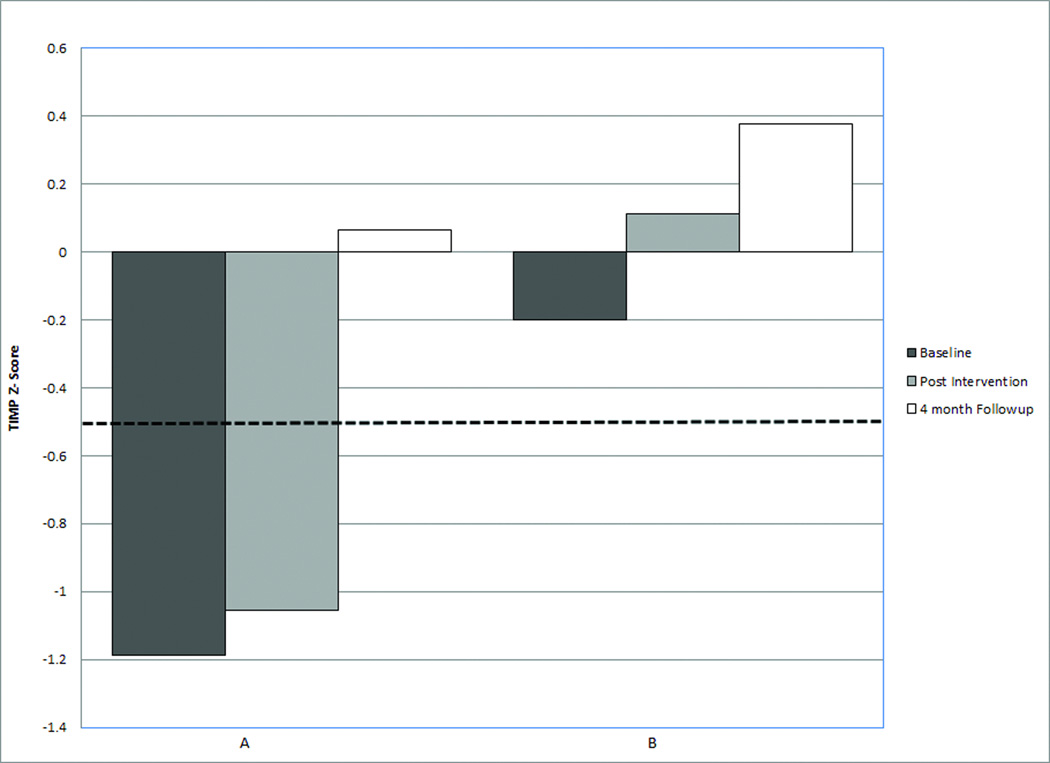
Figure 2.
Test of Infant Motor Performance Scores (TIMP) for each infant. 2A) Baseline TIMP Raw Score and Change in Raw TIMP score at each study visit. 2B) TIMP Z-score at each study visit. A z-score of 0 is equivalent to the mean for the infant’s age. Values above and below 0 are presented in standard deviations from the mean. TIMP scores of −0.5 (dashed line) or below are considered below average.24


