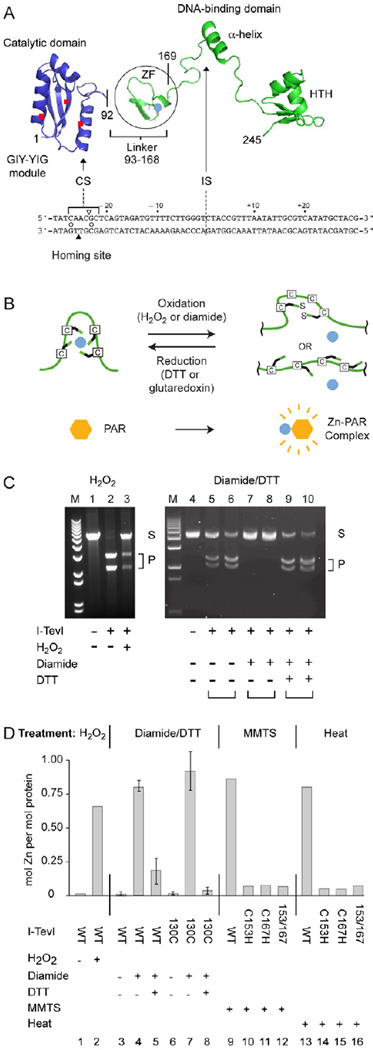
Figure 1. I-TevI cleavage is redox sensitive.
(A) Modular endonuclease I-TevI with zinc finger (ZF). The catalytic domain of the GIY-YIG endonuclease family is separated by a lengthy linker, which contains the ZF (Zn2+, turquoise dot), from the DNA binding domain with an α-helix and helix-turn-helix (HTH). I-TevI binds to the DNA homing site (below structure). The triangles indicate the cleavage on the top (open) and bottom (filled) strands, 23 and 25 nt from the intron insertion site (IS). The open circles between the strands indicate the two consensus nucleotides for cleavage.
(B) Redox scheme for ZF. The liberation and re-sequestration of a zinc ion (turquoise) under oxidative and reductive conditions is shown, with complexing of released Zn2+ by PAR reagent.
(C) Cleavage assays under different redox conditions. Cleavage of pBS tdΔIn substrate (250 ng) at 37°C with wild type I-TevI (25 ng) after treatment with 1 mM H2O2 for 5 min (lanes 1–3) or with I-TevI-H40Y (1.25 µg or 2.5 µg for each condition tested; I-TevI:DNA molar ratio 6:1 and 3:1, respectively), after treatment with 2.5 mM diamide in the absence and presence of 10 mM DTT for 15 min (lanes 4–10) is shown. S = substrate, P = cleavage products, M = size markers. The ability of T4 thioredoxin, Grx1, plus glutathione to provide reducing equivalents is shown in Supplemental Figure 1.
(D) Abstraction of Zn2+ from the I-TevI ZF and redox-dependent Zn2+ cycling. Zn2+ release from I-TevI-H40Y was measured by the PAR assay. Treatment (5 min) was with 0.5 mM H2O2, or 2.5 mM diamide and 10 mM DTT or 10 mM MMTS at 25°C or heat (100°C). WT was wild-type I-TevI in columns 1 and 2, and I-TevI-H40Y derivatives in columns 3–16. Truncated derivative C130 contains linker sequence (from residue 130) and the DNA binding domain, but not the catalytic domain [36]. Redox cycling (15-min incubation for each condition) is in columns 3–8. Error bars represent the results from three independent experiments.

