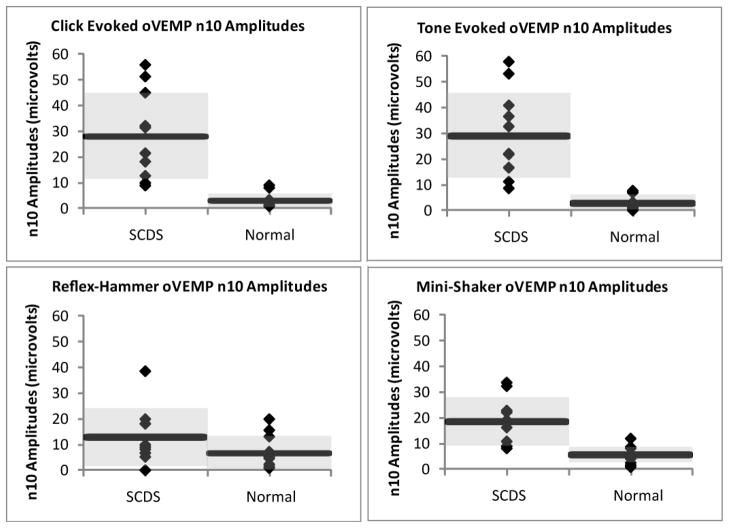
Figure 1. oVEMP n10 Amplitudes in SCDS Patients and Normal Subjects in Response to Clicks, Tones, Reflex-Hammer Taps, and Mini-shaker Taps.
Each diamond represents the oVEMP n10 amplitude of an individual subject, each horizontal bar represents the mean values within a group, and the shaded gray area encompasses one standard deviation above and below the mean.

