
Figure 9.
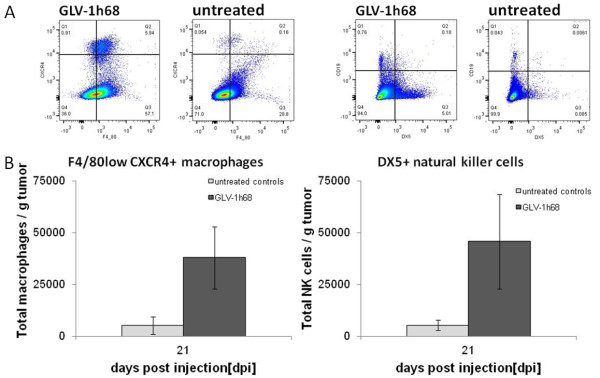
Flow cytometry analysis of innate immune cells in untreated and GLV-1h68-treated tumors. A) Representative flow cytometry plots of macrophage and NK cell populations in uninfected (n=4) and GLV-1h68-infected (n=5) HCT-116 tumors from flow cytometry analysis experiments at 21 days post treatment are shown. B) Quantification of total F4/80low CXCR4pos macrophages and CD19pos DX5pos NK cells per gram tumor after normalization by counting beads to quantify the total amount of cells per sample in untreated or GLV-1h68-treated HCT-116 tumors at 21 days post treatment. Average values with standard deviations are plotted. * = P≤0.05, ** = P≤0.005.