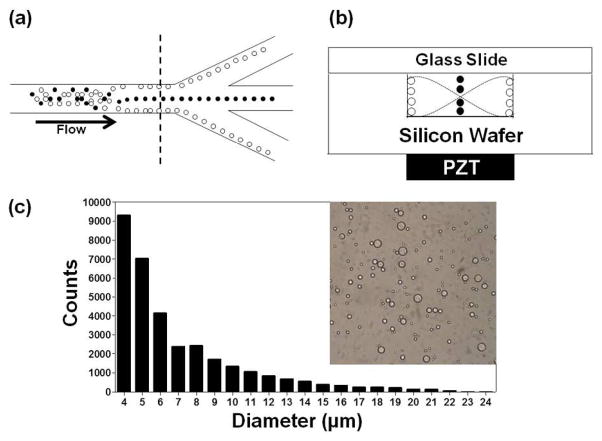
Figure 1.
(a) Schematic diagram depicting the separation approach for elastomeric negative acoustic contrast particles (white) from positive acoustic contrast particles (e.g., blood cells) (black) at the trifurcation in a silicon acoustic sample preparation chip. (b) Cross-section, at dashed line in (a), of the chip, with the positive contrast particles focused at the pressure node and the negative contrast particles focused at the pressure antinodes under an acoustic standing wave field. Note: Images are not drawn to scale. (c) Bright field image and size histogram of PDMS-based elastomeric particles prepared by bulk emulsification.

