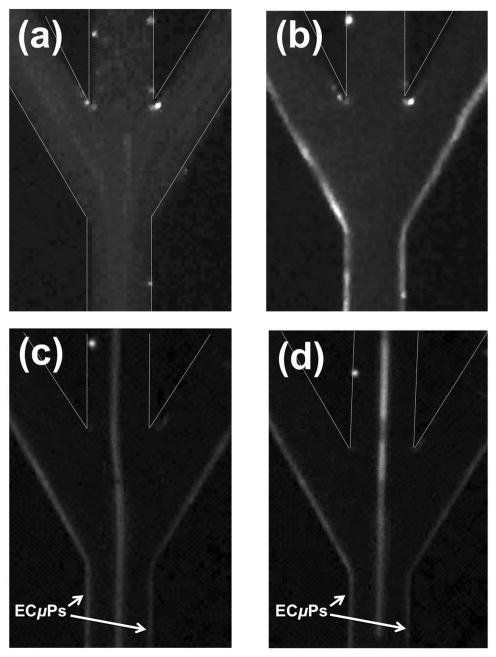
Figure 3.
(a) Fluorescence microscopy images of NR-ECμPs with the field (a) off and then (b) on. (c) NR-ECμPs separated from NR-PS particles with the field on. (d) NR-ECμPs separated from NR-blood cells (0.1% volume whole porcine blood) with the field on. Each sample was flowing at 45 μL/min. Note: white dashed lines indicate micro-channel borders that are not otherwise visible due to presence of NR-ECμPs.

