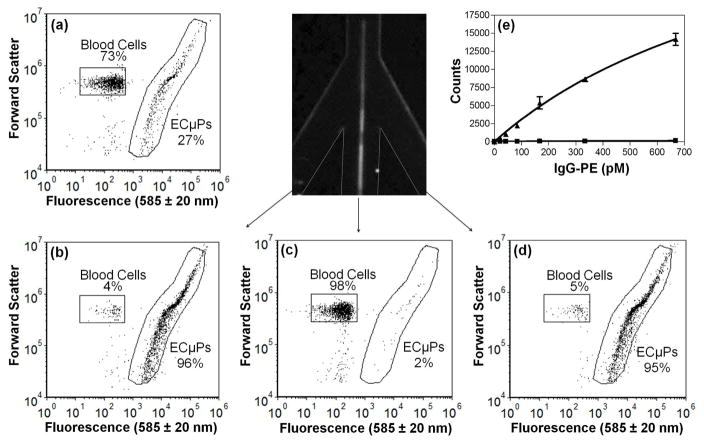
Figure 5.
ECμPs used in an assay in diluted blood where acoustic separation and collection was achieved using the acoustic sample preparation chip prior to flow cytometry analysis. (a)Flow cytometry scatter plot (forward scatter versus fluorescence (585 ± 20 nm)) showing the initial mixture (inlet) of ligand-bound ECμPs and blood cells. (b) Scatter plot of the collected fraction of the left peripheral outlet channel. (c) Scatter plot of the collected fraction from the central outlet channel. (d) Scatter plot of the collected fraction of the right peripheral outlet channel. (e) IgG-PE binding assay in 0.1 % porcine blood from ECμPs separated and collected using an acoustic sample preparation chip, prior to flow cytometry analysis. (▲) denotes ECμPs with capture antibody and (■) denotes particles without capture antibody. Note: all data points were obtained in triplicate. Error bars represent the standard deviation of the mean for 3 separate determinations of median fluorescence intensity.

