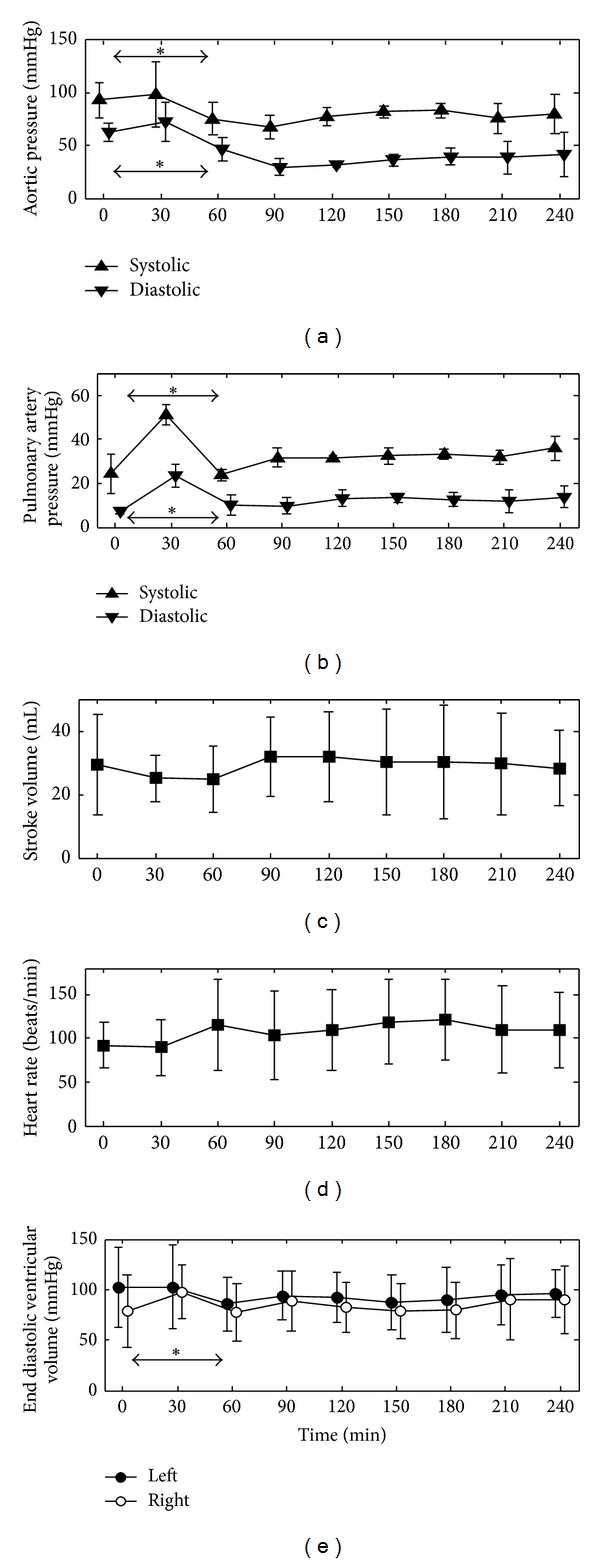
Figure 4.

Evolution of the averaged hemodynamic measurements recorded during the trials. *indicates P < 0.05 for expected temporal changes over T0–T30, T0–T60, or T30–T60 due to the induction of septic shock. The data is presented as mean ± one standard deviation.
