Figure 5.

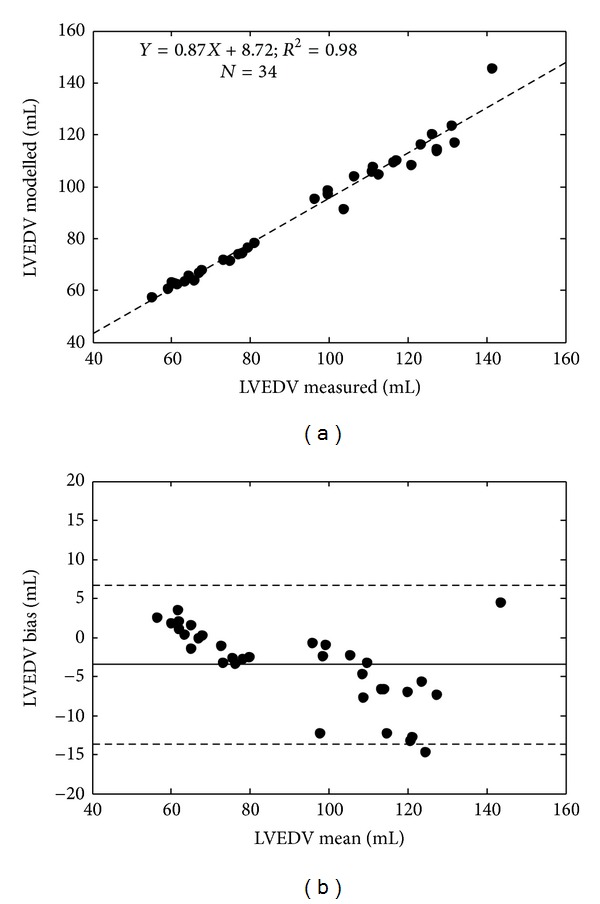
Regression (a) and Bland-Altman analysis showing 2 standard deviation limits (b) of the modelled and measured left ventricular end diastolic volume (LVEDV).

Regression (a) and Bland-Altman analysis showing 2 standard deviation limits (b) of the modelled and measured left ventricular end diastolic volume (LVEDV).