
Figure 4.
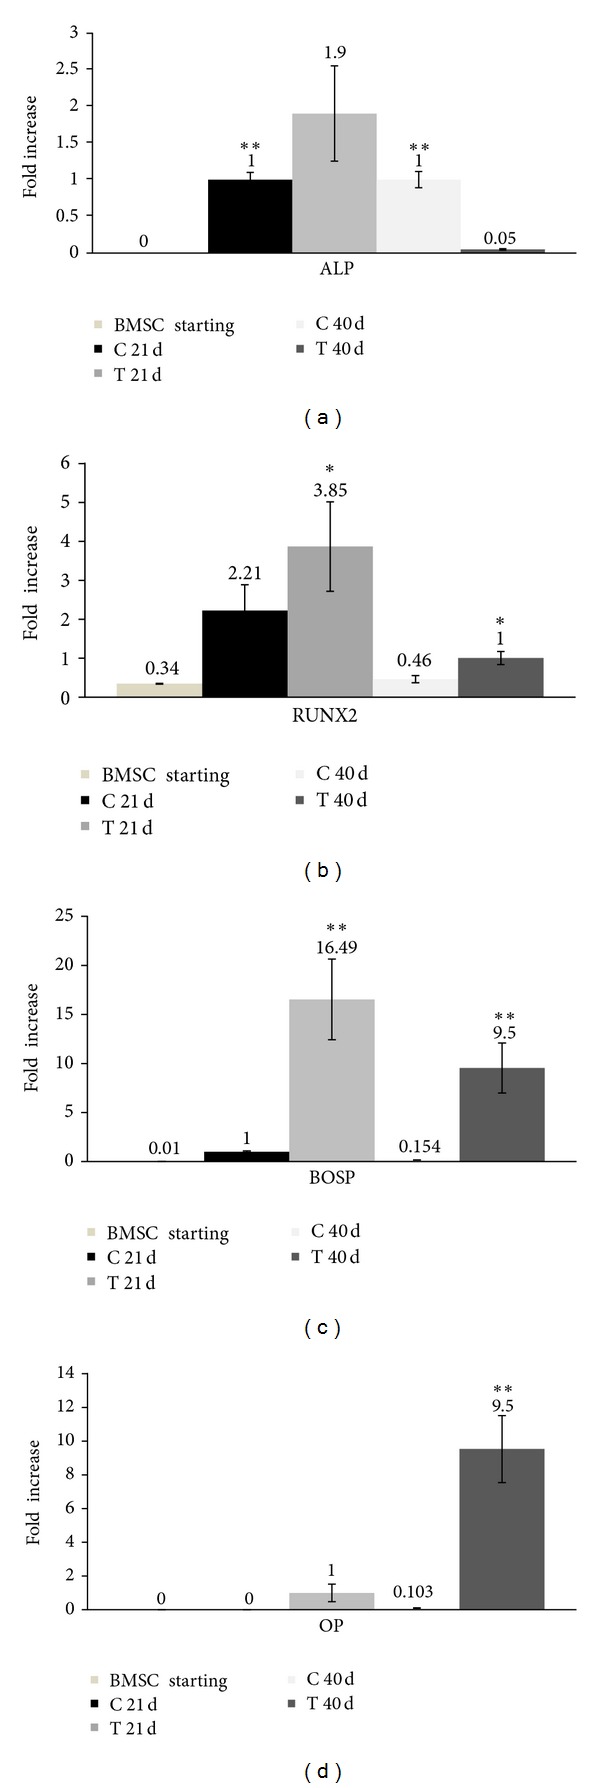
BMSC gene expression at the beginning of the stimulation (BMSC starting) and at 21 and 40 days. (a) qRT-PCR for ALP. (b) qRT-PCR for RUNX2. (c) qRT-PCR for BOSP. (d) qRT-PCR for OP. Results are normalized with reference to the housekeeping gene (GAPDH). Statistically significant values are indicated as *0.05 > P > 0.001 and **P < 0.001. The unpaired t-test was used to evaluate data significance.