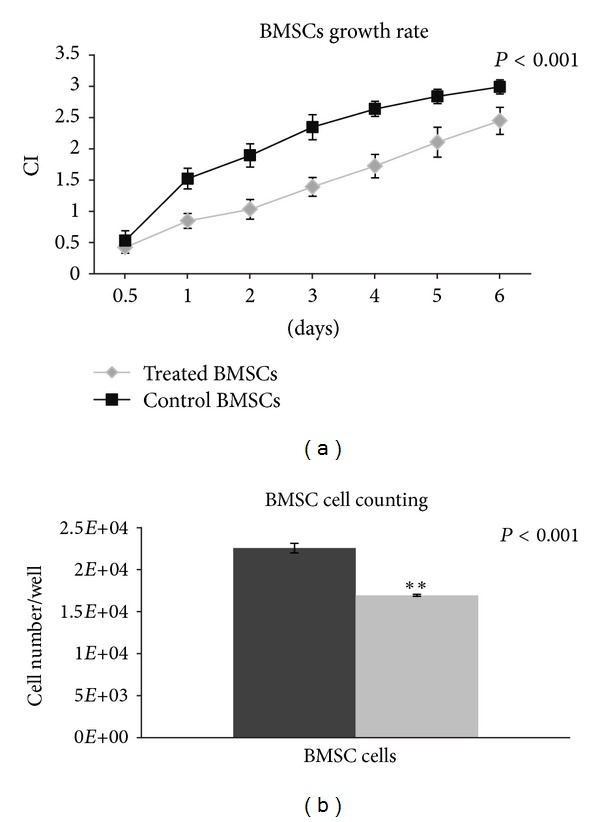
Figure 5.

xCELLigence and cell counts. (a) Growth comparison graph for treated and untreated BMSCs after one week of culture. (b) Representation of the number of control and treated BMSC. Statistically significant values are indicated as *0.05 > P > 0.001 and **P < 0.001. The paired t-test was used to evaluate significance of the xCELLigence data.
