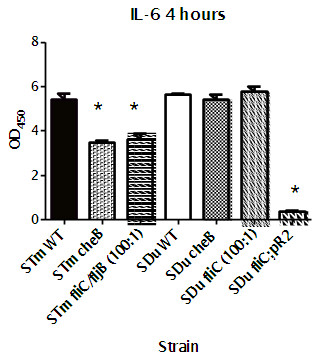
Figure 3.
Induction of IL-6 response in J774A.1 cells 4 hours post challenge with wild type and chemotaxis and flagella mutants of S. Dublin and S. Typhimurium.cheA mutants that had not given any phenotype in cell culture and mice assays were omitted from this analysis. As a control for level of uptake, the cells were challenged with flagella mutants of both serovars with MOIs of both 10:1 and 100:1. Results from the two testings were not significantly different. Only 100:1 results are shown in the figure. Significant (p<0.05) differences to the wild type strain of the same serovar are indicated by *.

