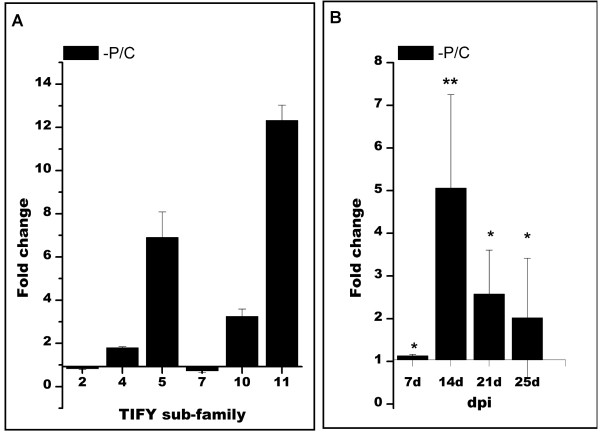
Figure 7.
Expression of PvTIFY genes in response to P-deficiency.n-Fold expression of PvTIFY genes from different subfamilies (A) and the PvTIFY10C gene (B) in common bean roots of plants grown in P-deficient conditions (−P) compared with roots from C plants (full-nutrient conditions). A Expression of PvTIFY genes was determined in roots from plants grown for 25 days. BPvTIFY10C expression was determined in roots at different stages of development, as indicated (d = days after planting). Values represent the average of three biological replicates. Asterisks represent significantly different means compared with the control conditions, according to statistical analysis (p < 0.05).

